In the News:
Global LNG trade increases by a record 10% in 2017
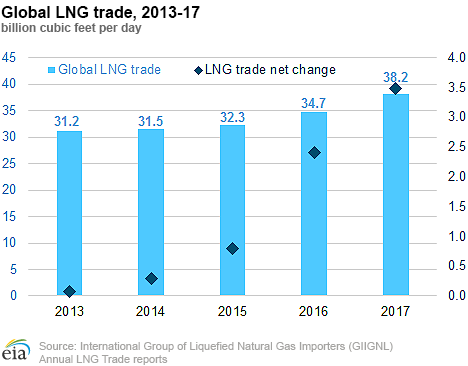
Global trade in liquefied natural gas (LNG) increased by 3.5 billion cubic feet per day (Bcf/d) to 38.2 Bcf/d in 2017, a 10% increase from 2016 and the largest annual increase since 2010, according to the recently released 2018 Annual Report on LNG trade by the International Group of Liquefied Natural Gas Importers (GIIGNL). In 2017, there were 19 LNG-exporting countries and 40 LNG-importing countries. Malta became the newest country to begin LNG imports in 2017.
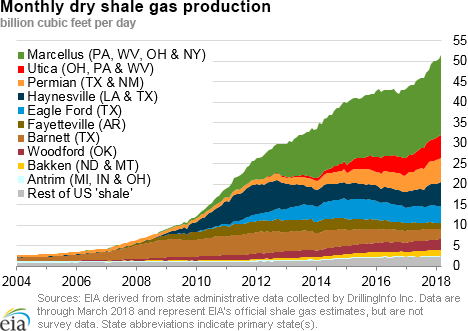
Strong growth in LNG trade was supported by new liquefaction capacity commissioned in Australia, the United States, and Russia, which collectively added five new liquefaction trains (combined 3.4 Bcf/d capacity). The world’s first floating liquefaction plant, Malaysia’s PFLNG Satu (0.2 Bcf/d capacity), was also commissioned in 2017.
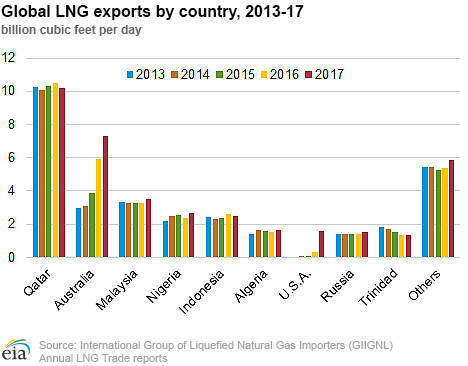
LNG exports from Australia and the United States accounted for more than three-quarters (2.7 Bcf/d) of the increase in global LNG exports in 2017 compared to 2016. Angola’s Soyo LNG plant returned to stable production in 2017, exporting 0.36 Bcf/d, after being shut down in 2014–16 because of technical issues with the liquefaction train. LNG exports from Trinidad, which have been decreasing in the past few years because of upstream natural gas feedstock shortages, decreased only slightly in 2017 (by 3%), as some progress has been made to bring online new production fields supplying the project.
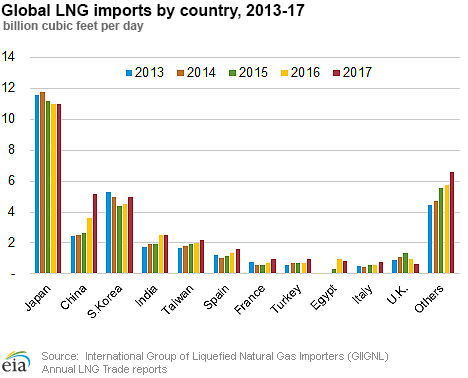
Asia led the growth in global LNG imports, accounting for 74% (2.6 Bcf/d) of the increase in 2017, with 8 out of 10 LNG-importing countries registering the increase. China had the largest growth in LNG imports globally, an increase of 1.5 Bcf/d (46%) year on year. China became the world’s second largest LNG importer in 2017, overtaking South Korea, as government policies promoting coal-to-gas switching led to a record growth in natural gas imports. South Korea had the second-largest increase in LNG imports among Asian countries (by 0.5 Bcf/d, 11% year on year), as several nuclear plants were taken offline for extended maintenance. Continuing its trend to move toward more natural gas-fired power generation, LNG imports also increased in Pakistan (by 0.2 Bcf/d, 57% year on year), as the country commissioned its second Floating Storage and Regasification Unit (FSRU) at the port of Qasim.
LNG imports also increased in Europe, primarily in southern Europe (Spain, Italy, Portugal), where a hot summer and lack of hydroelectric generation contributed to the increase. LNG imports also increased in France (by 0.24 Bcf/d, 32% year on year) as the country’s third regasification terminal entered commercial service in January 2017, and cold winter and weak renewables generation in the summer along with extended maintenance on several nuclear plants all contributed to increased demand for natural gas. The United Kingdom was one of only two countries in Europe where LNG imports declined in 2017 (by 0.34 Bcf/d, 35%) as lower winter heating demand from the residential sector and a strong wind generation output reduced the demand for natural gas.
LNG imports in South America (Brazil, Argentina, Chile, Colombia) remained essentially flat year on year. In North America, Mexico registered a slight increase in LNG imports (by 0.1 Bcf/d, 17%), as the country continued to rely on LNG supplies amid declining domestic production and construction delays in pipelines connecting the Mexican domestic grid to natural gas supply from the United States.
Overview:
(For the Week Ending Wednesday, May 2, 2018)
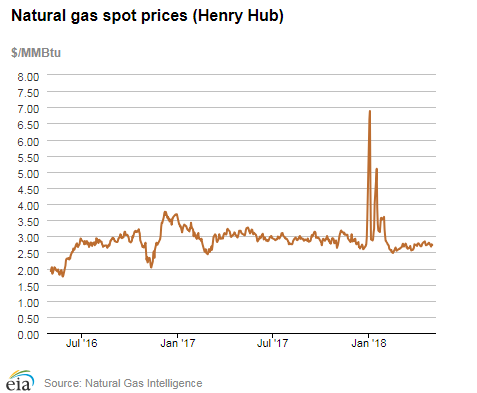
- Natural gas spot prices fell at most locations this report week (Wednesday, April 25 to Wednesday, May 2). The Henry Hub spot price fell from $2.79 per million British thermal units (MMBtu) last Wednesday to $2.73/MMBtu yesterday.
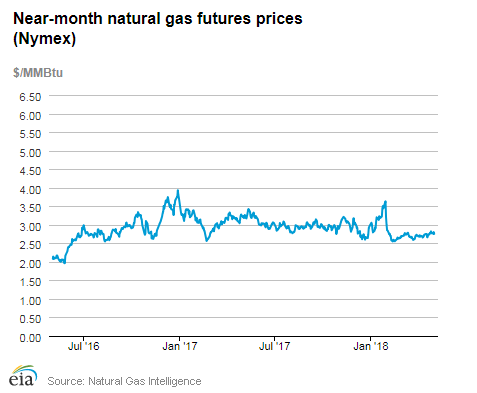
- At the New York Mercantile Exchange (Nymex), the May 2018 contract expired Thursday at $2.821/MMBtu. The June 2018 contract price decreased to $2.754/MMBtu, down 5¢ Wednesday to Wednesday.
- Net injections to working gas totaled 62 Bcf for the week ending April 27. Working natural gas stocks are 1,343 Bcf, which is 40% lower than the year-ago level and 28% lower than the five-year (2013–17) average for this week.
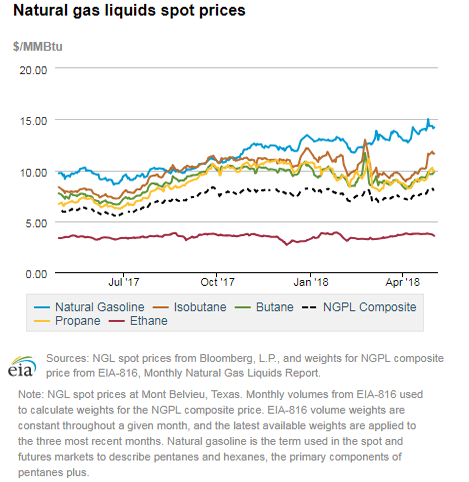
- The natural gas plant liquids composite price at Mont Belvieu, Texas, rose by 42¢, averaging $8.14/MMBtu for the week ending May 2. The price of ethane fell by 2%. The price of natural gasoline, propane, butane, and isobutane rose by 3%, 9%, 4%, and 13%, respectively.
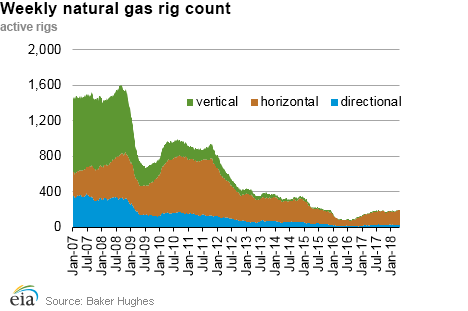
- According to Baker Hughes, for the week ending Tuesday, April 24, the natural gas rig count increased by 3 to 195. The number of oil-directed rigs rose by 5 to 825. The total rig count increased by 8, and it now stands at 1021.
Prices/Supply/Demand:
Spot prices fall across most of the country. This report week (Wednesday, April 25 to Wednesday, May 2), the Henry Hub spot price fell 6¢ from $2.79/MMBtu last Wednesday to $2.73/MMBtu yesterday, with a low of $2.68/MMBtu on Monday.
Midwest and Northeast prices mostly fall as temperatures rise. Cold temperatures in the Midwest and Northeast at the end of last week transitioned to warm temperatures this week. At the Chicago Citygate, prices decreased 20¢ from $2.61/MMBtu last Wednesday to $2.41/MMBtu yesterday. At the Algonquin Citygate, which serves Boston-area consumers, prices went down 10¢ from $2.72/MMBtu last Wednesday to $2.62/MMBtu yesterday, with a low of $2.48/MMBtu on Monday.
At the Transcontinental Pipeline Zone 6 trading point for New York City, prices increased 32¢ from $2.44/MMBtu last Wednesday to $2.76/MMBtu yesterday despite the warmer weather. Multiple maintenance events have constrained supply on Northeastern segments of the Transcontinental Pipeline, including on the Leidy Line (which feeds onto the Transcontinental Pipeline).
Tennessee Zone 4 Marcellus spot prices decreased 29¢ from $1.93/MMBtu last Wednesday to $1.64/MMBtu yesterday, with a low of $1.54/MMBtu on Monday. Prices at Dominion South in northwest Pennsylvania fell 12¢ from $2.32/MMBtu last Wednesday to $2.20/MMBtu yesterday, reaching a low of $2.05/MMBtu on Monday.
Prices increase in California. Prices at PG&E Citygate in Northern California rose 16¢, up from $2.70/MMBtu last Wednesday to $2.86/MMBtu yesterday. The price at SoCal Citygate ended 68¢ higher, from $2.94/MMBtu last Wednesday to $3.62/MMBtu yesterday, with a low of $2.62 on Friday. The prices at SoCal Citygate remain volatile as the region deals with ongoing capacity constraints. Cooler weather also potentially increased heating demand. Southern California Gas made net storage withdrawals on both Monday and Tuesday.
Rover Pipeline receives permission to place more facilities into service. On Tuesday, the Federal Energy Regulatory Commission authorized Rover Pipeline to place into service the remaining facilities from its April 13 in-service request. This request includes the new market segment, the compressor station in Defiance, Ohio, and the Vector meter station. Rover is not expected to have increased flow until supply laterals come online later this year.
May contract expires up while June contract falls. At the Nymex, the May 2018 contract expired Thursday at $2.821/MMBtu, up 4¢ from last Wednesday. The June 2018 contract decreased to $2.754/MMBtu, down 5¢ from last Wednesday to yesterday. The price of the 12-month strip averaging June 2018 through May 2019 futures contracts declined 5¢ to $2.816/MMBtu.
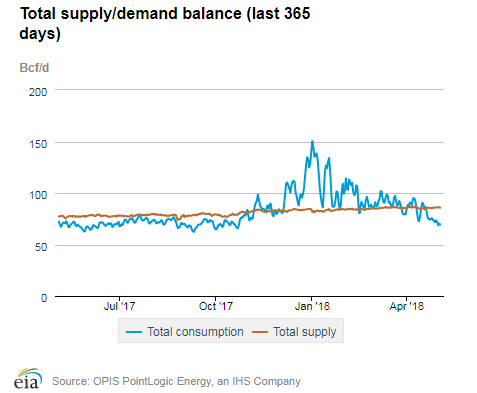
Supply rises. According to data from PointLogic Energy, the average total supply of natural gas rose by 1% compared with the previous report week. Dry natural gas production grew by 1% compared with the previous report week, and average net imports from Canada increased by 2%.
Demand falls. Total U.S. consumption of natural gas fell by 9% compared with the previous report week, according to data from PointLogic Energy. In the residential and commercial sectors, consumption declined by 26% as temperatures warmed in the Northeast and Midwest. Natural gas consumption in both the industrial and power sectors decreased by 2% week over week. Natural gas exports to Mexico increased 2%.
U.S. LNG exports decrease week over week. Five LNG vessels (combined LNG-carrying capacity 17.8 Bcf) departed the Sabine Pass liquefaction terminal from April 26 to May 2. On Wednesday, May 2, two vessels (combined LNG-carrying capacity 7.1 Bcf) were loading at the Sabine Pass terminal and one vessel (LNG-carrying capacity 3.5) was loading at the Dominion Energy Cove Point terminal.
Storage:
Working gas storage begins refilling after an unprecedented series of April withdrawals. Net injections into storage totaled 62 Bcf for the week ending April 27, which is in line with the five-year (2013–17) average net injection of 69 Bcf and last year's net injections of 68 Bcf during the same week. Unusually cold weather for most of April resulted in net withdrawals from storage for the first three weeks of the month. In the weekly data EIA publishes in the Weekly Natural Gas Storage Report (WNGSR), which dates back to 1993, there have never been three consecutive April withdrawals. Partly as a result of the prolonged withdrawal season, working gas stocks ended the storage week at 1,281 Bcf, which is 527 Bcf lower than the five-year average and 897 Bcf lower than last year at this time.
This week’s net change includes changes to base gas for the fourth week in row. Changes to base gas were reported to EIA for the storage week. These cumulative net withdrawals of base gas were treated as negative working gas stocks and were reflected in the working gas inventories reported in the WNGSR. These changes to base gas are expected to be temporary. EIA will continue to report base gas withdrawals until base gas is replenished.
The average June 2018 futures contract price trades very close to the average spot price. During the most recent storage week, the average natural gas spot price at the Henry Hub was $2.76/MMBtu, 1¢ lower than the front-month futures price at the Nymex. A year ago, the spot price was 8¢ lower than the front-month contract. The average Henry Hub spot price is somewhat elevated relative to February or March, which is likely related to the prolonged withdrawal season this year.
Reported net injection into storage is at the higher end of analyst expectations. According to The Desk survey of natural gas analysts, estimates of the weekly net change from working natural gas storage ranged from net injections of 45 Bcf to 68 Bcf, with a median estimate of 53 Bcf. At the 10:30 a.m. release of the WNGSR, 1,758 trades were executed, pushing the June Nymex price down by about 2¢ to $2.71/MMBtu, where it settled shortly thereafter.
Temperatures are in the normal range for the storage week. Temperatures in the Lower 48 states averaged 55 degrees Fahrenheit (°F), 1°F lower than normal and 3°F lower than last year at this time. Cooling degree days (CDD) in the Lower 48 states totaled 6, compared to 12 last year and a normal of 9. Heating degree days (HDD) in the Lower 48 states totaled 79, compared with 59 last year and a normal of 75.
See also:
| Spot Prices ($/MMBtu) | Thu, 26-Apr |
Fri, 27-Apr |
Mon, 30-Apr |
Tue, 01-May |
Wed, 02-May |
|---|---|---|---|---|---|
| Henry Hub | 2.80 | 2.77 | 2.68 | 2.75 | 2.73 |
| New York | 2.40 | 2.37 | 2.68 | 2.58 | 2.76 |
| Chicago | 2.61 | 2.52 | 2.37 | 2.40 | 2.41 |
| Cal. Comp. Avg.* | 2.29 | 2.13 | 2.09 | 2.22 | 2.25 |
| Futures ($/MMBtu) | |||||
| May Contract | 2.821 | Expired | Expired | Expired | Expired |
| June Contract | 2.839 | 2.771 | 2.763 | 2.802 | 2.754 |
| July Contract | 2.873 | 2.811 | 2.800 | 2.837 | 2.791 |
| *Avg. of NGI's reported prices for: Malin, PG&E Citygate, and Southern California Border Avg. | |||||
| Source: Natural Gas Intelligence | |||||
| U.S. natural gas supply - Gas Week: (4/26/18 - 5/2/18) | |||
|---|---|---|---|
Average daily values (Bcf/d): |
|||
this week |
last week |
last year |
|
| Marketed production | 90.4 |
89.9 |
80.2 |
| Dry production | 80.0 |
79.6 |
71.2 |
| Net Canada imports | 5.9 |
5.7 |
5.5 |
| LNG pipeline deliveries | 0.1 |
0.1 |
0.1 |
| Total supply | 85.9 |
85.4 |
76.8 |
|
Source: OPIS PointLogic Energy, an IHS Company | |||
| U.S. natural gas consumption - Gas Week: (4/26/18 - 5/2/18) | |||
|---|---|---|---|
Average daily values (Bcf/d): |
|||
this week |
last week |
last year |
|
| U.S. consumption | 57.8 |
63.6 |
56.9 |
| Power | 23.3 |
23.8 |
24.1 |
| Industrial | 20.4 |
20.8 |
20.2 |
| Residential/commercial | 14.1 |
19.0 |
12.6 |
| Mexico exports | 4.3 |
4.2 |
4.4 |
| Pipeline fuel use/losses | 6.1 |
6.5 |
5.9 |
| LNG pipeline receipts | 3.8 |
3.4 |
1.9 |
| Total demand | 71.9 |
77.7 |
69.1 |
|
Source: OPIS PointLogic Energy, an IHS Company | |||
| Rigs | |||
|---|---|---|---|
Tue, April 24, 2018 |
Change from |
||
last week |
last year |
||
| Oil rigs | 825 |
0.6% |
18.4% |
| Natural gas rigs | 195 |
1.6% |
14.0% |
| Note: Excludes any miscellaneous rigs | |||
| Rig numbers by type | |||
|---|---|---|---|
Tue, April 24, 2018 |
Change from |
||
last week |
last year |
||
| Vertical | 52 |
-3.7% |
-32.5% |
| Horizontal | 901 |
1.3% |
23.4% |
| Directional | 68 |
-2.9% |
7.9% |
| Source: Baker Hughes Inc. | |||
| Working gas in underground storage | ||||
|---|---|---|---|---|
Stocks billion cubic feet (Bcf) |
||||
| Region | 2018-04-27 |
2018-04-20 |
change |
|
| East | 223 |
205 |
18 |
|
| Midwest | 221 |
211 |
10 |
|
| Mountain | 86 |
84 |
2 |
|
| Pacific | 187 |
177 |
10 |
|
| South Central | 626 |
604 |
22 |
|
| Total | 1,343 |
1,281 |
62 |
|
| Source: U.S. Energy Information Administration | ||||
| Working gas in underground storage | |||||
|---|---|---|---|---|---|
Historical comparisons |
|||||
Year ago (4/27/17) |
5-year average (2013-2017) |
||||
| Region | Stocks (Bcf) |
% change |
Stocks (Bcf) |
% change |
|
| East | 322 |
-30.7 |
324 |
-31.2 |
|
| Midwest | 517 |
-57.3 |
381 |
-42.0 |
|
| Mountain | 152 |
-43.4 |
126 |
-31.7 |
|
| Pacific | 232 |
-19.4 |
240 |
-22.1 |
|
| South Central | 1,023 |
-38.8 |
807 |
-22.4 |
|
| Total | 2,246 |
-40.2 |
1,877 |
-28.4 |
|
| Source: U.S. Energy Information Administration | |||||
| Temperature – heating & cooling degree days (week ending Apr 26) | ||||||||
|---|---|---|---|---|---|---|---|---|
HDD deviation from: |
CDD deviation from: |
|||||||
| Region | HDD Current |
normal |
last year |
CDD Current |
normal |
last year |
||
| New England | 120 |
6 |
15 |
0 |
0 |
0 |
||
| Middle Atlantic | 106 |
9 |
26 |
0 |
0 |
0 |
||
| E N Central | 111 |
11 |
44 |
0 |
0 |
-2 |
||
| W N Central | 119 |
29 |
24 |
0 |
-2 |
0 |
||
| South Atlantic | 43 |
-1 |
16 |
21 |
1 |
-9 |
||
| E S Central | 53 |
13 |
28 |
0 |
-6 |
-17 |
||
| W S Central | 48 |
32 |
29 |
8 |
-19 |
-31 |
||
| Mountain | 94 |
-5 |
2 |
13 |
3 |
0 |
||
| Pacific | 25 |
-33 |
-15 |
1 |
-3 |
1 |
||
| United States | 79 |
4 |
20 |
6 |
-3 |
-6 |
||
|
Note: HDD = heating degree day; CDD = cooling degree day Source: National Oceanic and Atmospheric Administration | ||||||||
Average temperature (°F)
7-Day Mean ending Apr 26, 2018
Source: NOAA National Weather Service
Deviation between average and normal (°F)
7-Day Mean ending Apr 26, 2018
Source: NOAA National Weather Service