This report highlights findings from the U.S. Energy Information Administration's 2015 RECS, which collected information about energy characteristics from a representative sample of U.S. households. More details about energy-consuming equipment and behavior in the residential sector are available in the household characteristics tables. This report was updated in May 2018 to reflect revised data.
Results from EIA's 2015 Residential Energy Consumption Survey (RECS)
Households account for 55% of the energy used in buildings in the United States. In order to understand how energy is consumed in U.S. homes, EIA conducts a detailed study of household energy use. Results from the most recent study, the 2015 RECS, describe the characteristics that contribute to energy consumption in homes today and highlight the variability in the way energy is used across the nation's 118.2 million households.[1]
The way households use energy varies by geographic location, structural features, equipment choices, and energy sources used. Electric heat pumps, for example, are well-suited for heating in areas where winters are relatively mild. Of the 11.8 million households in 2015 that used electric heat pumps, 8.4 million (71%) were in the South. The high cost of electric heating in colder climates has often limited the use of heat pumps and other electric equipment in those areas. Population movement to warmer climates has also increased household use of air conditioning. In 2015, more than 76 million households (64%) used a central air-conditioning system, an increase from less than 66 million households (59%) in 2005. Space conditioning (heating and air conditioning) accounts for about half of all energy consumed in the residential sector.
The 2015 RECS household survey included more than 200 questions about space heating, air conditioning, water heating, appliances, electronics, and structural features. In addition to devices and fuels, the survey included demographic and behavioral questions that help explain energy usage differences among households. The 2015 RECS household survey also added questions to reflect changes in home energy use, including new questions about light emitting diode bulbs (LEDs) and smart thermostats.
Location and structural features that affect energy use vary according to age of the home
Results from the 2015 RECS illustrate unique energy characteristics of the nation's housing stock, including the newest homes. The current stock of occupied housing units includes nearly 21 million homes built from 2000 to 2015.
The Hot-Humid climate zone, which stretches from Florida to southeastern Texas, has seen a surge in new home construction over the past few decades, particularly compared to the rate of construction in colder areas. While all homes in the Hot-Humid zone make up 19% of all U.S. households, nearly 28% of homes built since 2000 are in that area. Given the warmer weather and predominance of the use of electricity in home cooling, average household electricity consumption is higher in that climate zone than in other areas of the country.

Note: The 2015 RECS used climate zones as defined by Building America.
Source: U.S. Energy Information Administration, 2015 Residential Energy Consumption Survey.
No matter where they are located, new homes are characterized by different structural features than older homes. According to the 2015 RECS, more than half of all new homes had high ceilings, compared with 30% of homes built before 2000.[2] High ceilings tend to increase heating loads. At the same time, double- and triple-pane windows, which reduce the loss of heated and cooled air, were also more prevalent in new homes.
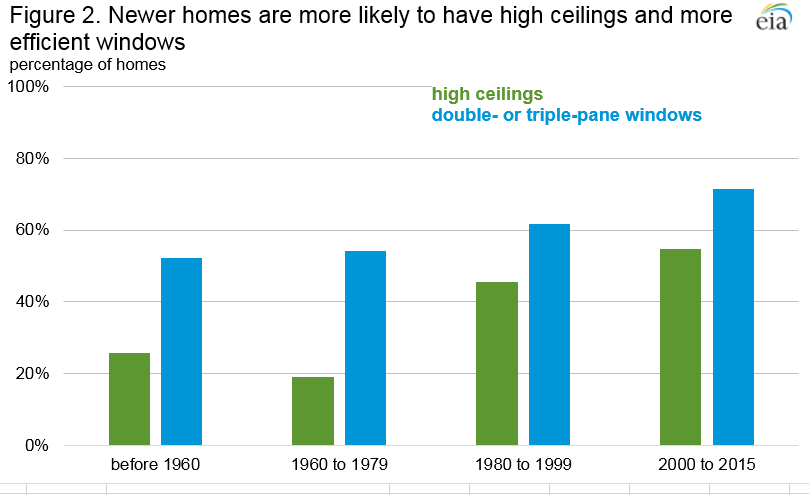
Note: High ceilings share excludes mobile homes, which were not asked about ceiling height.
Source: U.S. Energy Information Administration, 2015 Residential Energy Consumption Survey.
How does EIA collect data from more than 5,600 U.S. households?
For the 2015 RECS, the 14th iteration of the study, EIA selected households to survey using a multi-stage, area probability sample design. The list of housing units EIA used to select the sample (the "frame") is constructed almost entirely from a U.S. Postal Service (USPS) address list. Trained staff completed the frame by visiting selected areas and listing housing units that are missing from the USPS list. This design ensures that all occupied housing units in the United States have a chance of being selected. The final sample for the 2015 RECS was designed to allow EIA to produce estimates of energy consumption for the United States as a whole, for each Census Region, and for Census Divisions. The sample design and sample size did not allow EIA to produce estimates for individual states.
A total of 5,686 households participated in the 2015 RECS household survey. EIA collected information using either an in-person interview conducted by field staff, a self-administered online questionnaire, or a self-administered paper survey. Each approach to answering the survey delivers results of comparable quality. Most responses (57%) were from the online or paper surveys and the 2015 RECS is the first time EIA has used online and paper questionnaires extensively. More details about how EIA conducted the 2015 RECS are available in the Technical Documentation Summary.
RECS is a multi-year effort consisting of the household survey phase, data collection from household energy suppliers, and end-use consumption and expenditures estimation. The supplier data collection phase ended in February 2017. EIA will use the household characteristics data and the supplier billing data to model energy end-use consumption and expenditure estimates for housing units.
Most households use more than one fuel
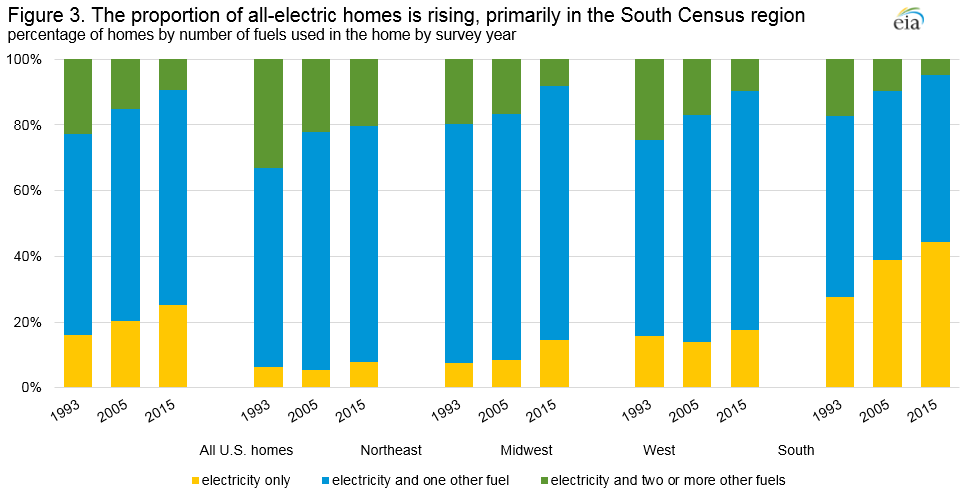
Many U.S. households rely on a variety of sources to meet their home energy needs. In 2015, 75% of U.S. households used more than one source of energy: 66% used electricity and one other fuel and 9% used three or more sources. A quarter of households used only electricity. The combination of energy sources used in households takes many forms, from widespread use of natural gas and petroleum fuels in cold regions to less frequent use of wood in a fireplace as a secondary heat source. When classifying homes by type of construction, single-family detached homes were the least likely to be all electric (18% in 2015), while mobile homes were the most likely (44% in 2015).
Source: U.S. Energy Information Administration, 2015 Residential Energy Consumption Survey.
Did You Know?
The 2015 RECS asked respondents about the availability of natural gas in their neighborhoods. Natural gas was accessible to 82 million homes. Of those who had access to it, 84% of households actually used natural gas.
Electric space heating is becoming more common
Trends in space heating are partly responsible for the increase in all-electric homes in the United States. In 2015, electricity was used as the main source of energy for space heating in 36% of homes that were heated, an increase from 2009 that continues a long-term trend. Natural gas continued to be the most common energy source for main space heating at 51% of heated homes in 2015. The proportion of heated homes using propane (4%) was one percentage point lower than 2009.
Types of energy used for main space heating vary by region. In the South Census region, where winters tend to be milder and homes do not require as much heat to reach a comfortable temperature, electricity was the most commonly used main space heating source. In the other three regions, natural gas was the dominant energy used for main space heating. Fuel oil was used very little, except in the Northeast, where it was used in 23% of heated homes in 2015. Even there, the share of heated homes using fuel oil decreased, down from 29% of homes in 2009.

Note: Fuel oil includes homes that used kerosene.
Source: U.S. Energy Information Administration, 2015 Residential Energy Consumption Survey.
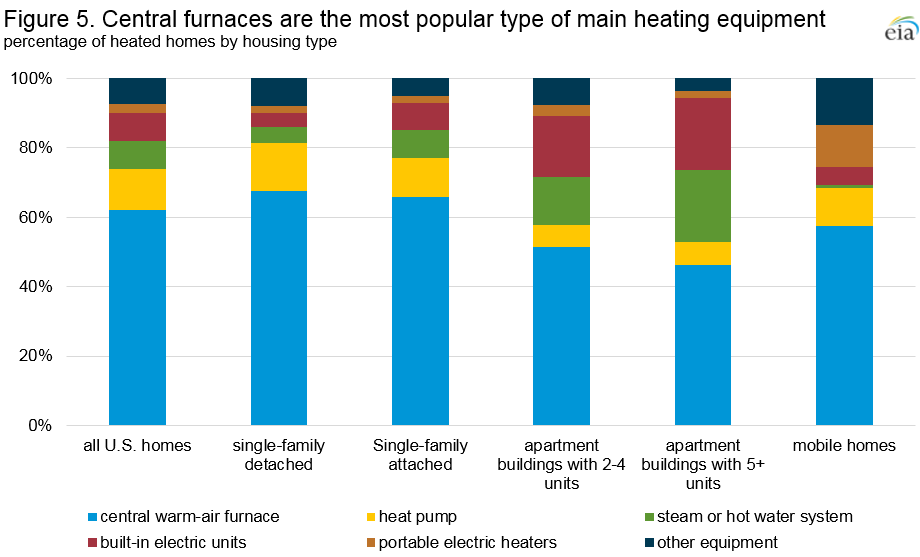
In addition to the energy source, the 2015 RECS asked respondents about the types of equipment used for main space heating. Across all housing types, central warm-air furnaces were the most common in the United States. Built-in electric units and steam or hot water systems, which use a central boiler to heat water that is circulated through radiators, were more prevalent in apartments than in other housing types. Mobile homes accounted for the widest use of portable electric heaters as main space heating equipment.
Source: U.S. Energy Information Administration, 2015 Residential Energy Consumption Survey.
A new question on the 2015 RECS household survey captured how respondents interact with their main space heating equipment controls. The most common behavior was to set the heating equipment at one temperature and leave it there most of the time, occurring in 40% of heated homes. Other households adjusted the temperature of their home based on the time of day or occupancy, either by manually adjusting the temperature (26% of heated homes), by programming a thermostat to adjust the temperature (17% of heated homes), or by turning the equipment on and off as needed (15% of heated homes). During the winter, the mean daytime temperature when homes were occupied was 70.0 degrees. Respondents kept their homes slightly cooler when no one was home and at night, when the mean reported temperature settings were 67.1 and 68.1 degrees, respectively.
Nationwide, 38% of all heated homes used at least one other form of heating equipment in addition to their main heat source. Portable electric heaters were the most commonly reported equipment, used in 46% of homes that have secondary heating.
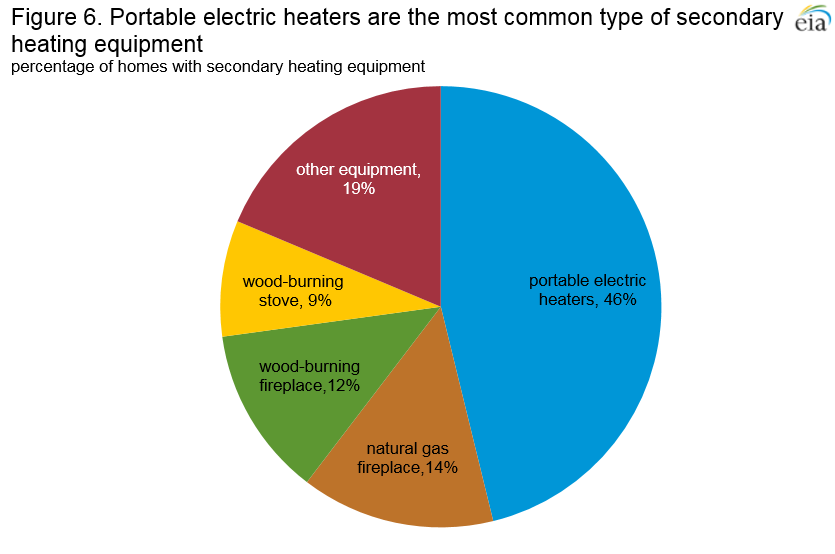
Note: Data may not sum to total because of rounding.
Source: U.S. Energy Information Administration, 2015 Residential Energy Consumption Survey.
Use of air conditioning continues to grow
The share of homes in the United States using air conditioning continued to increase in 2015, reaching 87% nationwide. Use of both central air-conditioning equipment and individual units, whether portable or installed in windows or walls, increased in 2015 compared to 2009. The share of air-conditioned homes with central equipment has remained relatively consistent since 2001, while the choice to use individual units has varied more from survey to survey. Individual air-conditioning units can be added or removed more easily than central equipment
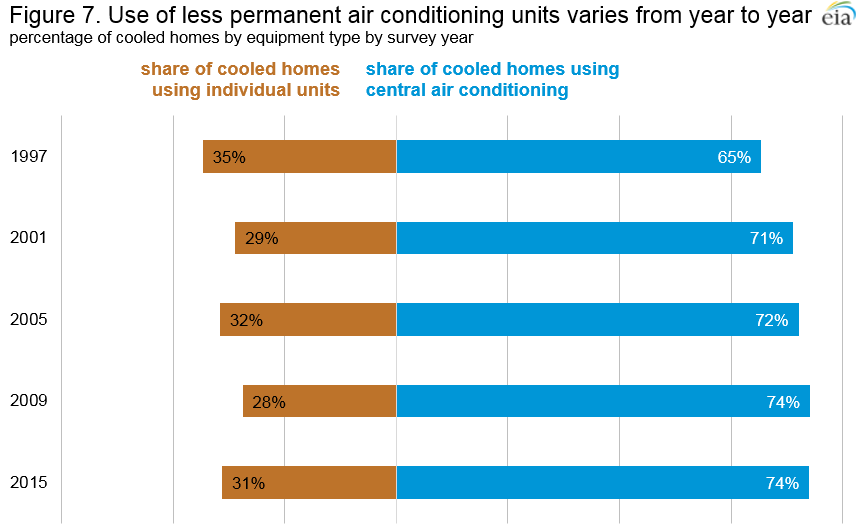
Note: Some homes have more than one type of air-conditioning equipment.
Source: U.S. Energy Information Administration, 2015 Residential Energy Consumption Survey.
Although central air-conditioning equipment has become more common in homes overall, newly-constructed homes drove the growth. Across all four Census regions, 86% of homes built since 2000 have central air conditioning.
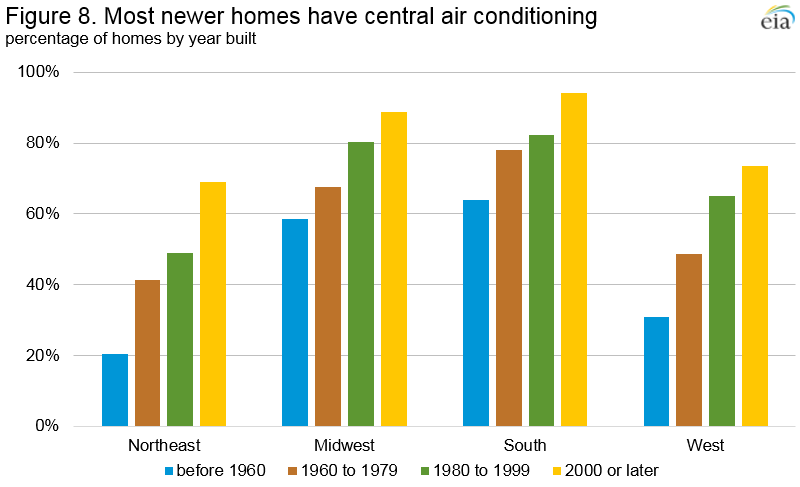
Source: U.S. Energy Information Administration, 2015 Residential Energy Consumption Survey.
How U.S. households control their air conditioning varies greatly by the type of equipment. Of households with central air conditioning in 2015, 18% programmed their thermostat to automatically adjust the temperature. As with heating equipment, the most common behavior reported for central air-conditioning systems was to "set one temperature and leave it there most of the time." For individual units, the most frequent behavior was to turn the equipment on and off as needed (46% of all homes with window or wall units).
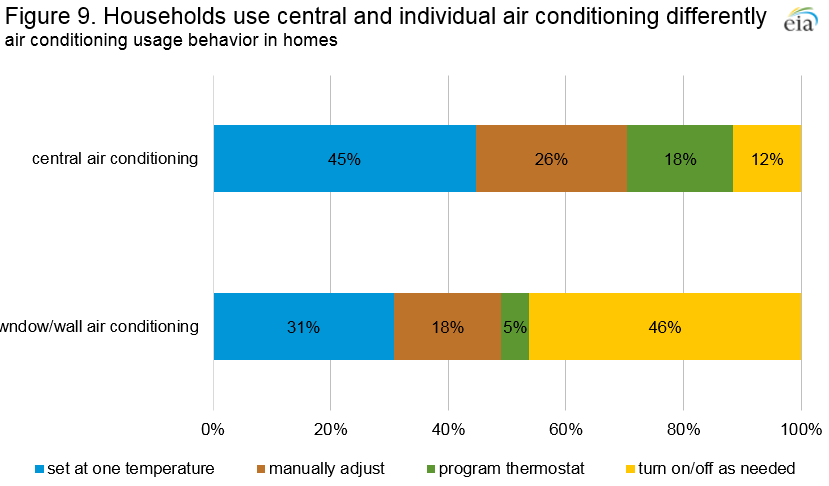
Source: U.S. Energy Information Administration, 2015 Residential Energy Consumption Survey.
Number of homes with a second refrigerator continues to rise
Refrigerators have been reported in nearly 100% of U.S. households since the first RECS in 1978, but the number of homes with more than one refrigerator has increased dramatically over time. From 1978 to 1997, the percentage of households with a second refrigerator was between 12% and 15% in every survey cycle. That percentage doubled to 30% of all housing units in 2015.
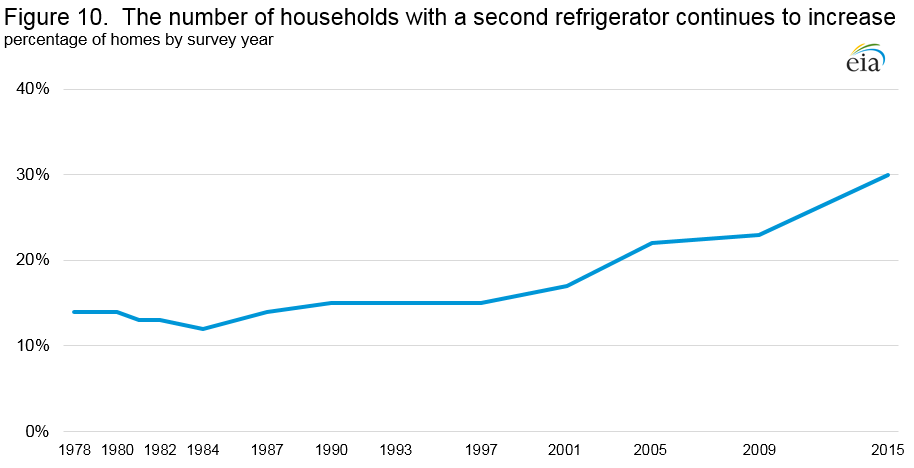
Source: U.S. Energy Information Administration, 2015 Residential Energy Consumption Survey.
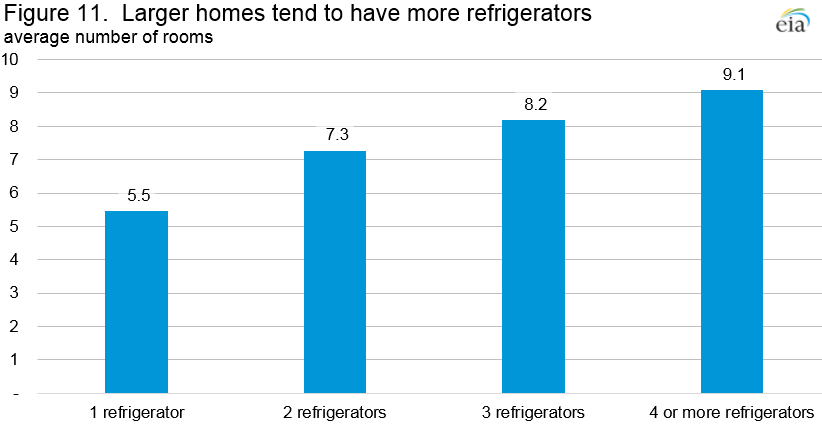
Eighty-six percent of second refrigerators were in single-family detached houses. The number of rooms in the home is directly related to having a second refrigerator. Households with only one refrigerator reported an average of 5.5 rooms, while households with two refrigerators reported an average of 7.3 rooms. Higher income levels are also correlated with the number of refrigerators in a home.
Source: U.S. Energy Information Administration, 2015 Residential Energy Consumption Survey.
Many homes have, but do not use, a dishwasher
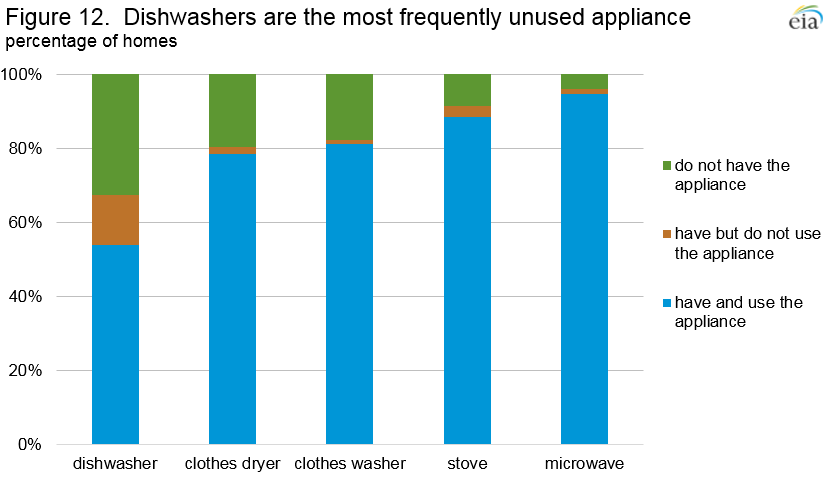
The 2015 RECS questionnaire was updated to capture major appliances that are installed in homes but not used. Compared with clothes washers, dryers, and cooking appliances, dishwashers were by far the most unused device in homes. Of the 79.7 million U.S. households that had a dishwasher, 20% (16.0 million), never used it. As a result, only 54% of all households in 2015 actually had and used a dishwasher. About 25% of the households that owned a dishwasher but did not use it were in apartments in buildings with five or more units.
Source: U.S. Energy Information Administration, 2015 Residential Energy Consumption Survey.
Households are consuming information and entertainment through a variety of electronics
Household electronics technology has continued to advance rapidly, and the RECS questionnaire has changed as well. As recently as 1990, RECS questions concerning electronics were limited to two questions about televisions and a single question about computers. The 2015 RECS included 25 items relating to information and entertainment devices in the home, making it one of the largest sections of the questionnaire.
The pace of computer saturation in the United States over the past 20 years has been dramatic. In 1990, just 16% of households owned a computer. In 2015, 78% of all households owned at least one computer and 43% owned more than one. For the first time, the 2015 RECS also asked about tablets. Tablets, as well as smartphones, have evolved as substitutes for some features of desktops and laptops. Ninety percent of homes had at least one desktop, laptop, tablet, or smartphone, and 79% have more than one. The energy use of tablets and smart phones is less than desktop or laptop computers.
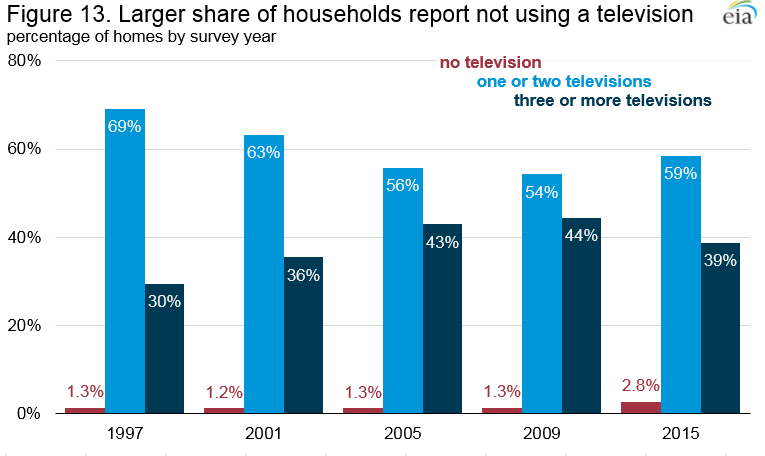
Although U.S. homes have an increasing number of computers, the number of televisions per home is declining. In 2015, homes had an average of 2.3 televisions, down from an average of 2.6 televisions per home in 2009. More than twice as many households reported not using a television in 2015 compared to 2009. The number of homes with three or more televisions declined as well.
Source: U.S. Energy Information Administration, 2015 Residential Energy Consumption Survey.
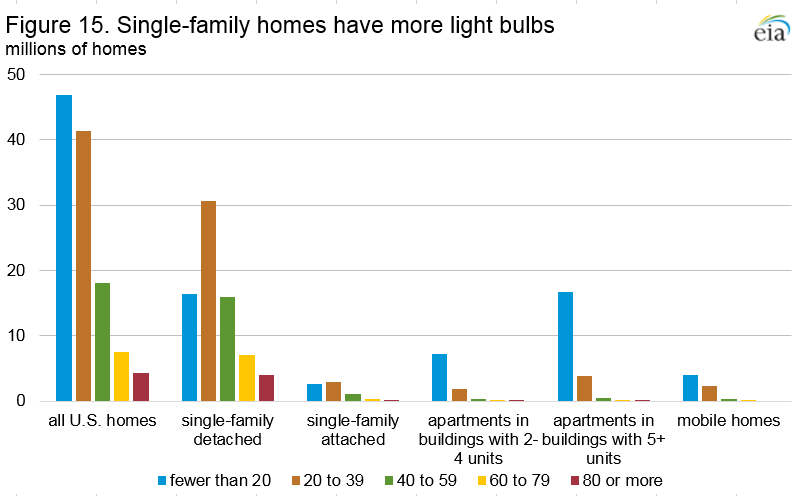
New lighting questions capture total number of bulbs and penetration of LEDs
To more accurately reflect the new lighting products available to households, the 2015 RECS lighting section was significantly updated. The major trend in U.S. household lighting has been the shift from less-efficient lighting—primarily incandescent bulbs—to more energy-efficient lighting—including compact fluorescent lamps (CFLs) and light emitting diode bulbs (LEDs).
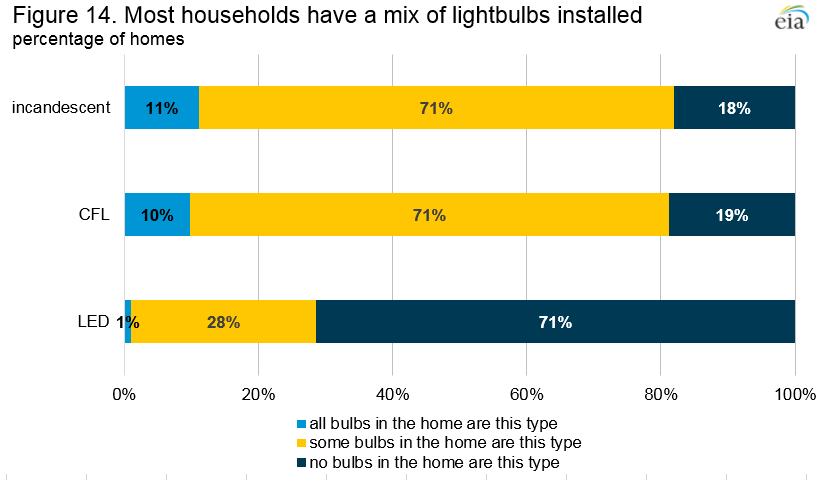
In 2009, only 58% of U.S. households reported any indoor energy-efficient bulbs in use for at least one hour per day. The 2015 RECS found that 81% of all households reported having at least one CFL installed, and 29% of all households reported at least one LED installed. Only 11% of households reported that all of their light bulbs are incandescent, while 18% reported no incandescent light bulbs.
Note: Detail may not sum to 100% due to rounding.
Source: U.S. Energy Information Administration, 2015 Residential Energy Consumption Survey.
Sixty percent of U.S. homes had 20 or more light bulbs installed. Thirty-five percent of homes had between 20 and 39 light bulbs installed, but 25% had 40 or more light bulbs installed in the home. Although many of these bulbs are not used frequently, the average household reported using more than seven bulbs at least four hours per day. As one would expect, the number of bulbs in use increases as the number of rooms in the housing unit increases—the average number of rooms in homes that reported fewer than 20 bulbs was 4.5, while the average number of rooms in homes that use 80 bulbs or more was 9.5.
Source: U.S. Energy Information Administration, 2015 Residential Energy Consumption Survey.
Additional detail on the structure and content of U.S. homes is available in the housing characteristics tables of the 2015 RECS. Energy consumption and expenditures tables, including consumption per household and detailed end-use estimates, are also available. A public-use microdata file is available for more detailed analysis.
Footnotes
1.This iteration of the RECS represents energy characteristics and usage data for the 118.2 million occupied, primary housing units in 2015 as defined by the U.S. Census Bureau's American Community Survey. RECS excludes vacant, seasonal or vacation homes, and group quarters such as prisons, military barracks, dormitories, and nursing homes.
2.The determination of whether a house has any high ceilings was made by respondents answering the question, "Most ceilings are about 8 feet high which is about a foot higher than a standard door. Are any of the ceilings in your home unusually high?"
Specific questions on this product may be directed to Chip Berry.
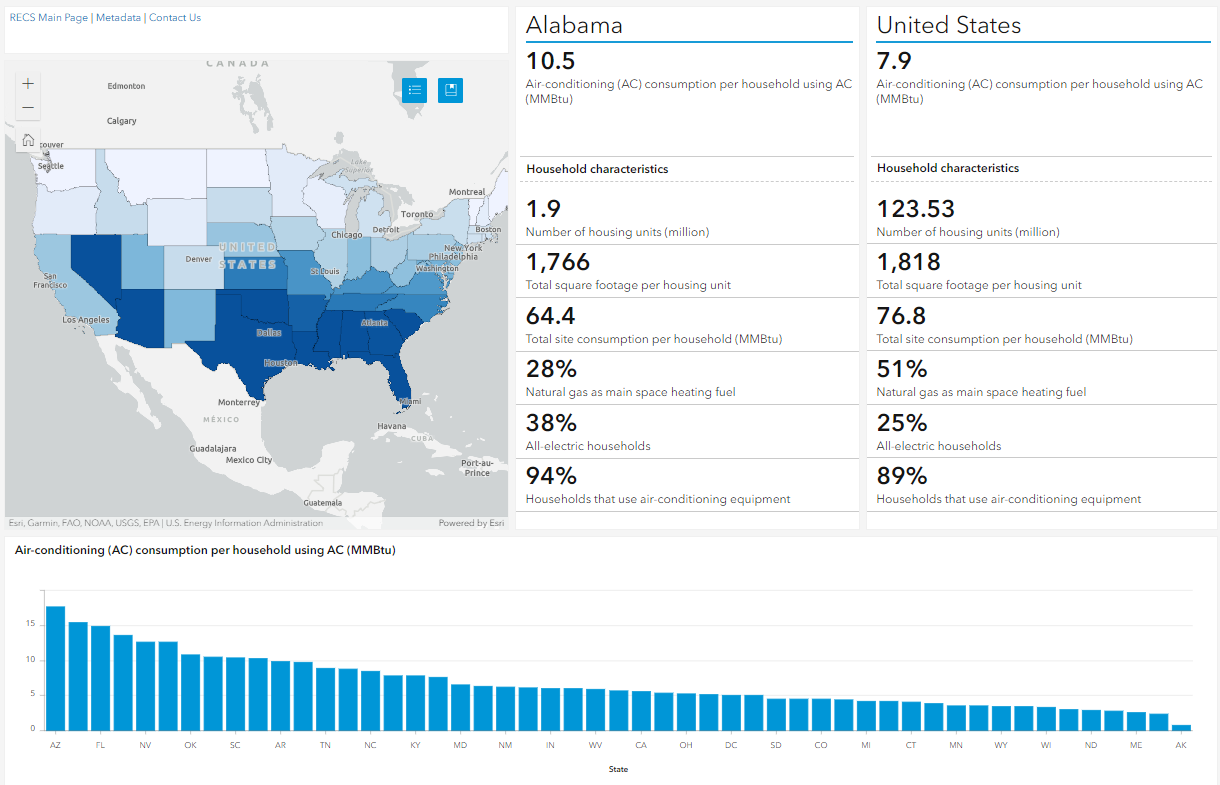 View the dashboard ›
