Older than 990 days
Coal Transportation Rates to the Electric Power Sector
Jan 29, 2024
This recent update to the Coal Transportation Rates to the Electric Power Sector web page incorporates final Form EIA-923 data for 2022 and updates the tables with data in nominal and real 2022 dollars. In 2008, EIA began collecting the commodity cost of all coal delivered to power plants with a combined nameplate capacity of 50 megawatts or greater on Form EIA-923, Power Plant Operations Report. Because we already collect delivered cost for the same shipments, we calculate a proxy for transportation cost by subtracting the commodity cost from the delivered cost. On Form EIA-923, the owners or operators of all applicable plants must provide the quantity (in tons), commodity cost, and total delivered cost (both in cents per million British thermal units) of all coal shipments by fuel supplier and by month.
Monthly Energy Review
Jan 29, 2024
The Monthly Energy Review is our comprehensive report on recent and historical energy statistics. According to our January 2024 report, preliminary estimates indicate that U.S. net imports of primary energy decreased from -523 trillion British thermal units (Btu) in October 2022 to -814 trillion Btu in October 2023.
Wholesale Electricity Market Data
Jan 25, 2024
This site contains spreadsheets with wholesale electricity and natural gas data from seven major trading hubs that cover most regions of the United States. The data are through January 23, 2024, republished, with permission, from the Intercontinental Exchange (ICE).
Electric Power Monthly
Jan 24, 2024
Data in the January 2024 Electric Power Monthly (EPM) are for November 2023, when net generation in the United States was unchanged from November 2022. Consumption of natural gas for power generation was up 6.0% compared with November 2022. The average residential retail price of electricity was up 4.1% from November 2022.
State Energy Portal: Updated Analyses and Quick Facts
Jan 19, 2024
We updated Analyses and Quick Facts for:
- Delaware
- District of Columbia
- Virginia
- West Virginia
Drilling Productivity Report
Jan 16, 2024
The Drilling Productivity Report has been updated with the latest charts and methodology. This report uses recent data on the total number of drilling rigs in operation along with estimates of drilling productivity and estimated changes in production from existing oil and natural gas wells to provide estimated changes in oil and natural gas production for seven key regions.
Wholesale Electricity Market Data
Jan 11, 2024
This site contains spreadsheets with wholesale electricity and natural gas data from seven major trading hubs that cover most regions of the United States. The data are through January 9, 2024, republished, with permission, from the Intercontinental Exchange (ICE).
Short-Term Energy Outlook
Jan 9, 2024
This edition of our Short-Term Energy Outlook (STEO) is the first to include forecasts for 2025.
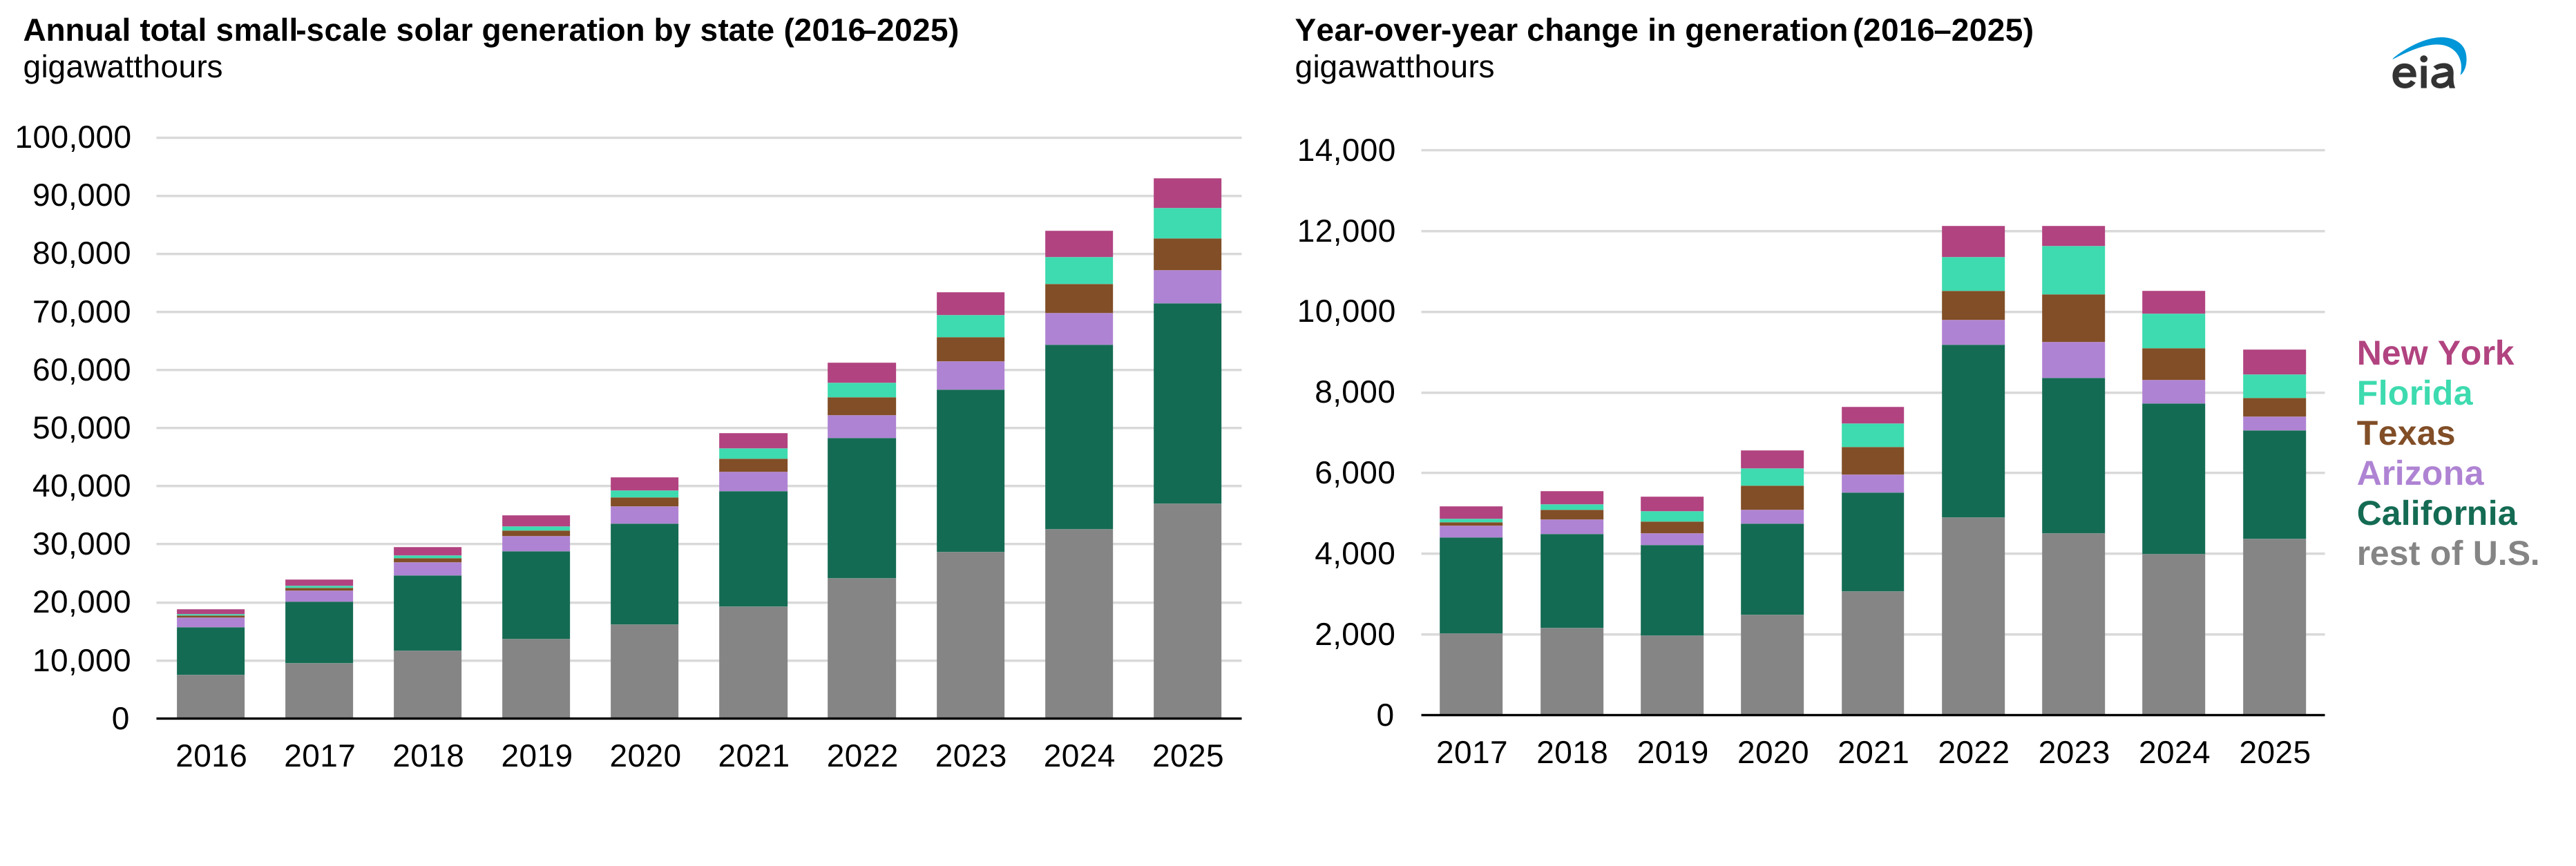
Electricity generation. We expect solar power to be the leading source of growth in electricity generation in both 2024 and 2025 as 36 gigawatts (GW) and 43 GW of new solar capacity come on line, respectively. The new capacity will boost the solar share of total generation to 6% in 2024 and 7% in 2025, up from 4% in 2023. We forecast that overall U.S. electricity generation will grow by 3% in 2024 and be unchanged in 2025. Driven by our forecast of rising generation from solar and to a lesser extent wind, we expect that electricity generation from coal will decline by 9% in 2024 and by 10% in 2025, due to a combination of higher costs compared with renewables and another 12 GW of coal-fired capacity retiring over the next two years. We expect that electricity generation from natural gas will be unchanged in 2024 and 2025 compared with 2023.
State Energy Data System: Natural gas through 2022
Jan 5, 2024
Annual state-level estimates of natural gas consumption, prices, and expenditures.
Renewable Electricity Infrastructure and Resources Dashboard
Jan 5, 2024
We have created a new dashboard of renewable electric energy in our U.S. Energy Atlas. This dashboard will consolidate the previous Biomass, Geothermal, Hydroelectric, Wind, and Solar maps into one new product that includes a map as well as charts and tables. This new tool provides stakeholders the ability to make selections and filter by state or renewable source.
Quarterly Coal Distribution Report (QCDR)—Third-Quarter 2023
Jan 2, 2024
The Quarterly Coal Distribution Report (QCDR) provides detailed U.S. domestic coal distribution data (excluding waste coal and imports) for third-quarter 2023 by coal-origin state, coal-destination state, mode of transportation, and consuming sector. Quarterly coal distribution data for all quarters are preliminary and will be updated in the corresponding Annual Coal Distribution Report.
Petroleum Marketing Monthly
Jan 2, 2024
The January 2024 Petroleum Marketing Monthly (PMM), with data through October 2023 presents monthly and annual price and volume statistics for crude oil sales in the United States.
Quarterly Coal Report (QCR)—Third-Quarter 2023
Jan 2, 2024
U.S. coal production during the third quarter of 2023 totaled 145.6 million short tons (MMst), which was 2.3% higher than the previous quarter and 5.7% lower than the third quarter of 2022. Third-quarter 2023 U.S. coal exports (24.9 MMst) increased 3.2% from second-quarter 2023 and increased 17.9% from third-quarter 2022. U.S. coal imports in the third quarter of 2023 totaled 1 MMst. All data for 2022 and previous years are final. All data for 2023 are preliminary.