
Refinery closures present risk for higher gasoline prices on the West Coast
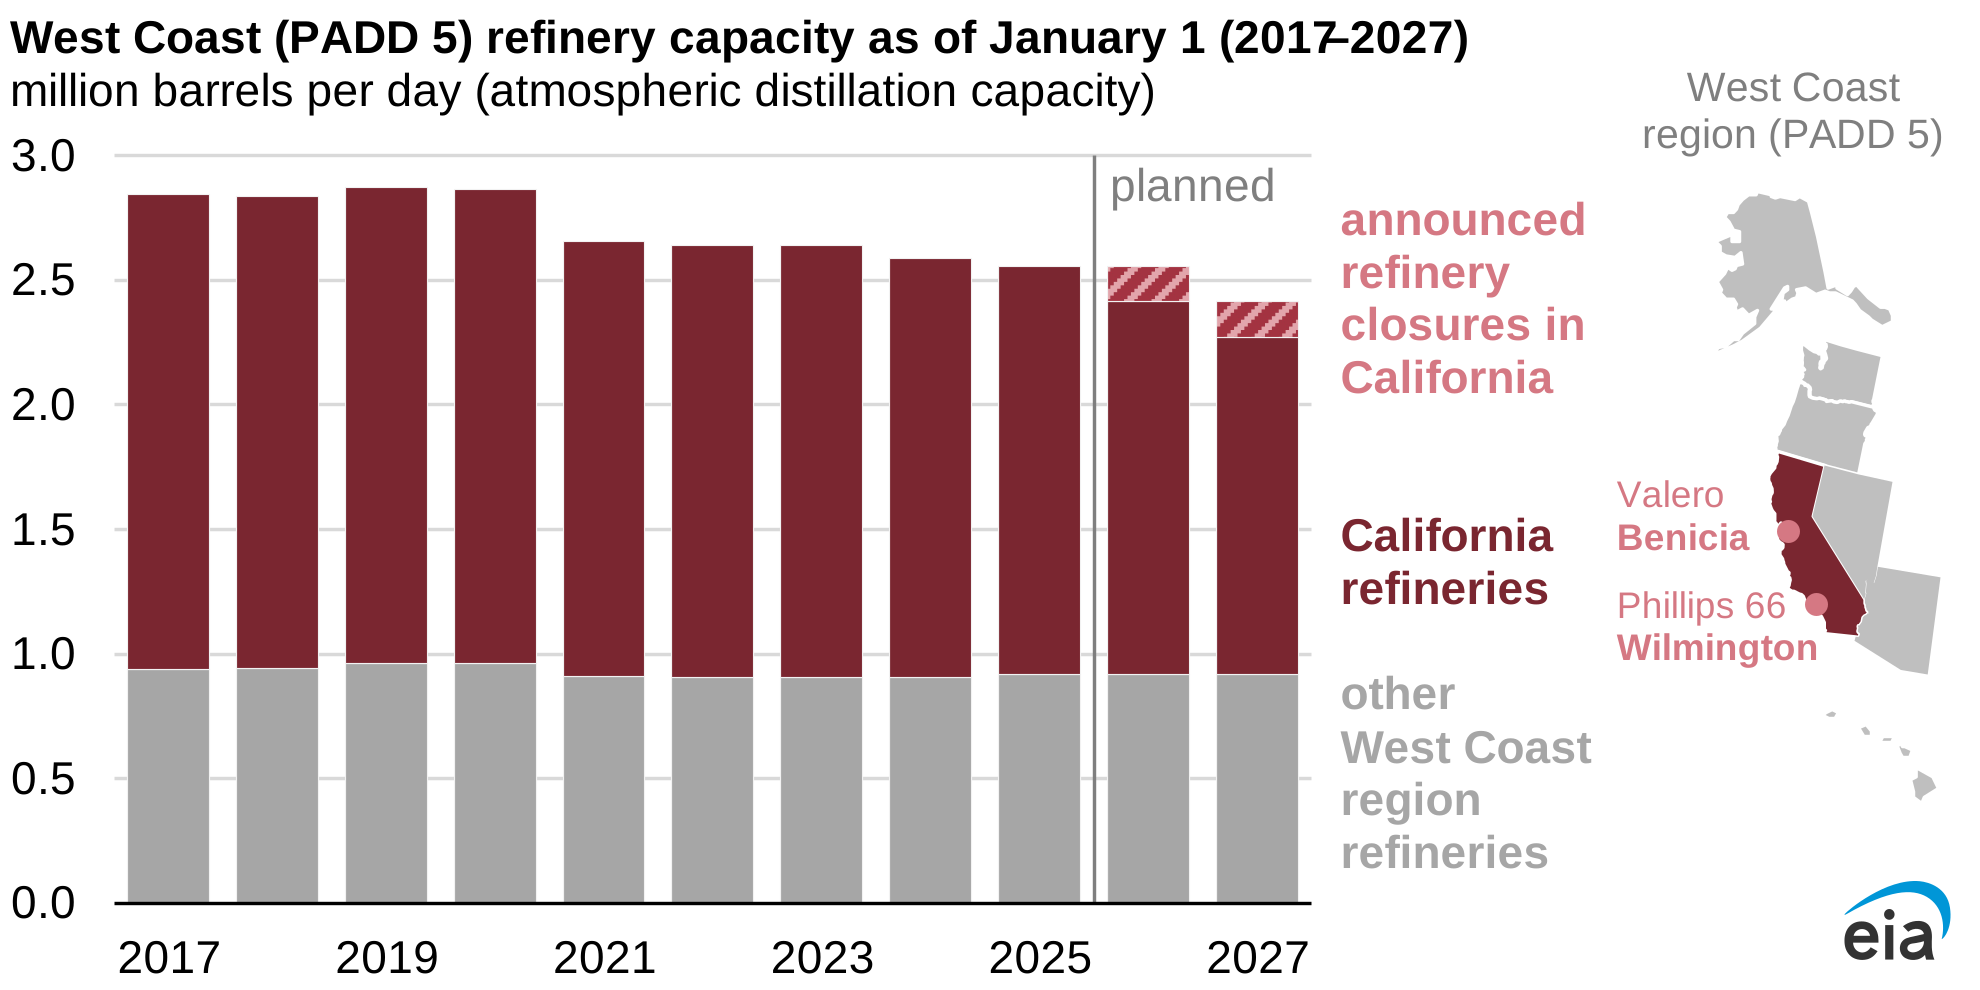
Note: Refinery Capacity Report data are reported as of January 1 of each year, so changes in capacity that take place during a given year are represented in the newly reported total capacity number for the start of the following year.
California is set to lose 17% of its oil refinery capacity over the next 12 months because of two planned refinery closures. If realized, the closure of the facilities is likely to contribute to increases in fuel price volatility on the West Coast.
Phillips 66 announced plans last October to close its 139,000-barrel-per-day (b/d) Wilmington refinery in the Los Angeles area later this year. Valero submitted a notice in April to end refining operations at its 145,000-b/d Benicia refinery in the Bay Area by the end of April 2026. The refinery closures continue a trend of decreasing refinery capacity on the West Coast, following the end of petroleum refining operations at Phillips 66’s Rodeo refinery early last year and the closure of Marathon’s Martinez refinery in 2020.
California usually has higher retail gasoline prices compared with the national average. One reason is the relative lack of logistical connectivity on the West Coast to other refinery hubs in the United States, such as the Gulf Coast. Although the Los Angeles and Benicia refineries make up less than 2% of current U.S. refining capacity, they account for 17% of California refinery capacity and 11% of West Coast (PADD 5) capacity. The supply shortfall left by their exit is therefore likely to have an outsized impact on the region because it cannot be easily filled by other refineries elsewhere in the country.
Given the limited connectivity to other U.S refining hubs, the most likely source of replacement fuels will be imports from Asia, particularly imports of jet fuel and gasoline. California’s unique specification gasoline blendstock, known as CARBOB, can only be manufactured by properly equipped refineries. Phillips 66 is planning to produce some California-grade gasoline at its refinery in Washington, and some refineries in India and South Korea can meet these specifications. Arizona, which also has a unique gasoline blend, and Nevada receive fuel shipments from California refiners and are also likely to be affected by the reduced regional supply.
Data for late May 2025 showed total gasoline imports (including finished gasoline and blend components) into the West Coast above 210,000 b/d, setting a record on a four-week average basis. Although these imports have since come down in June, summer imports are likely to further increase next year after the two California refineries come offline.
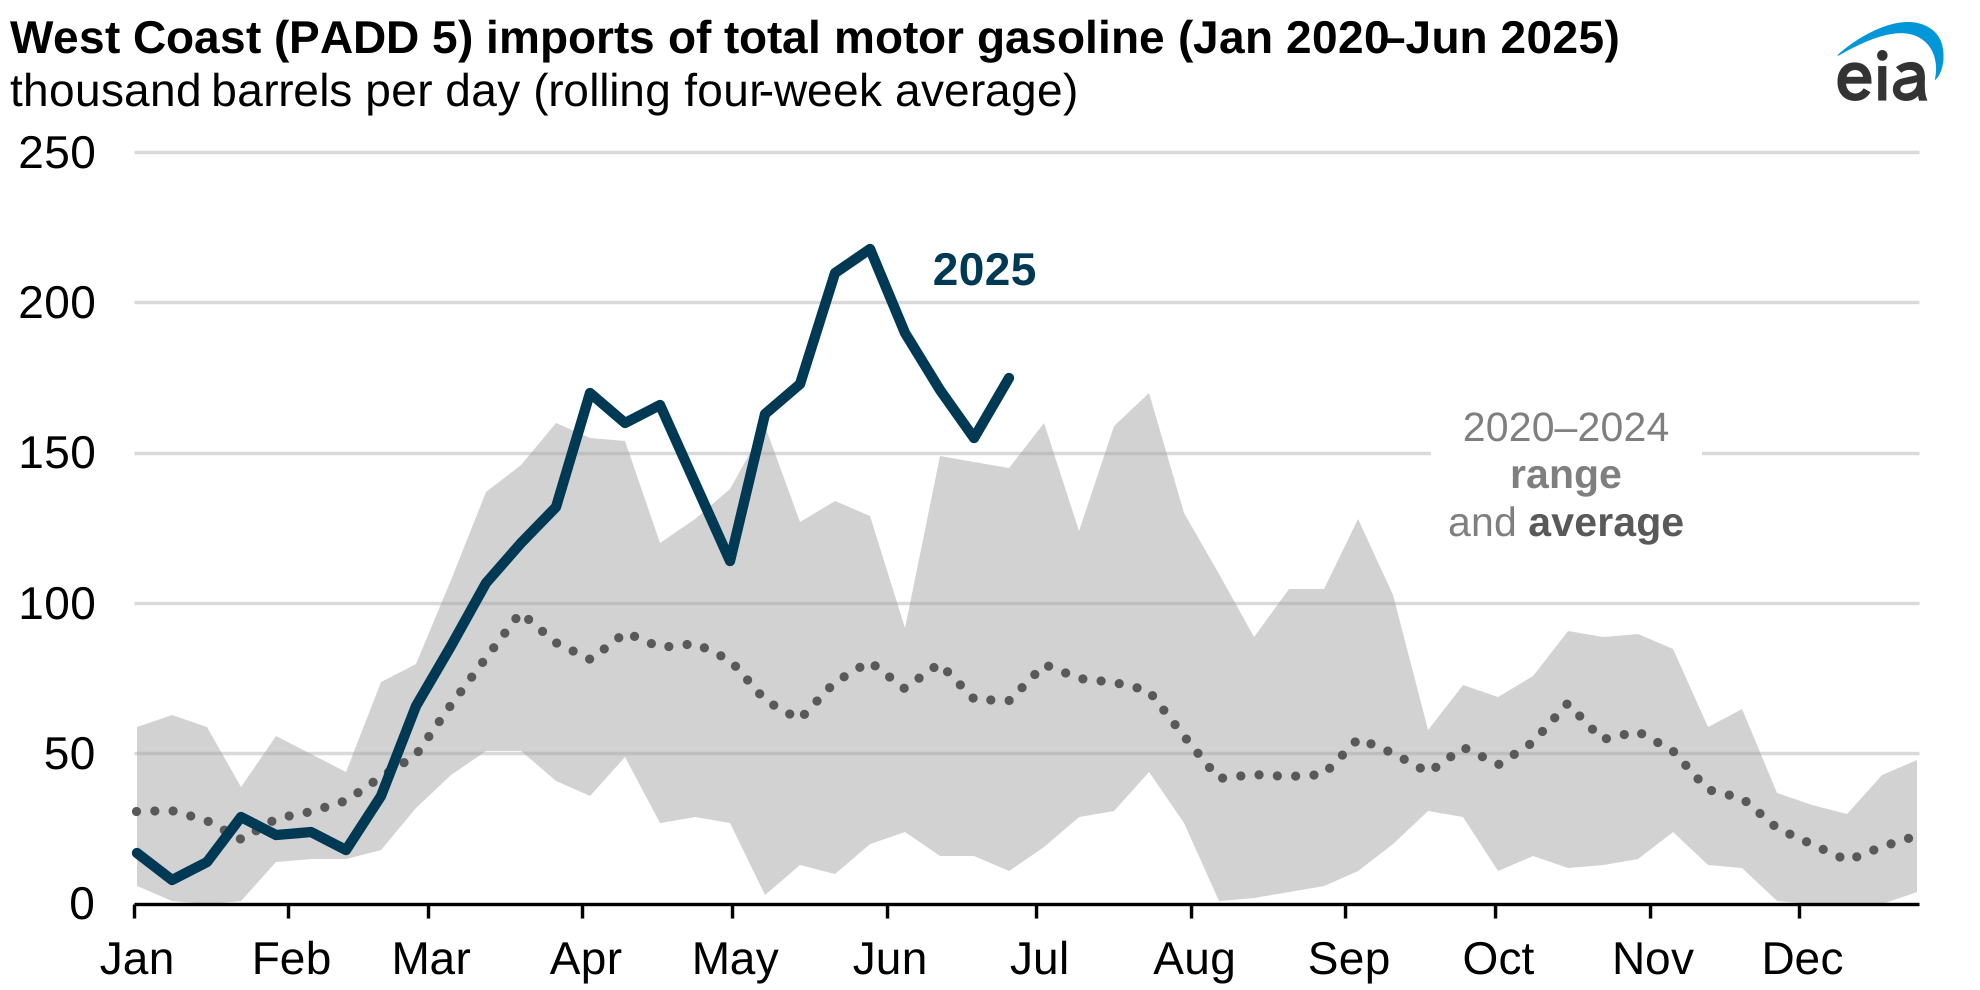
Importing petroleum products presents certain risks for fuel supplies on the West Coast. Shipments of petroleum products across the Pacific Ocean will take longer to respond to market demands, meaning that unexpected shortfalls could contribute to temporary price increases or heightened volatility. Last year, the California state government instituted a new minimum inventory law, which could reduce the risk of potential shortfalls in gasoline supplies.
In our July Short-Term Energy Outlook, we forecast a small increase in West Coast retail gasoline prices next year in response to the capacity closures, in contrast to price decreases elsewhere in the country. We expect lower crude oil prices, which account for around half of the price of gasoline, in 2026 to counteract some of the effect of the refinery closures on retail gasoline prices in the near term.
Principal contributor: Kevin Hack
Tags: refineries, gasoline, PADD 5, liquid fuels, prices, West Coast, California, states