
Southwestern states have better solar resources and higher solar PV capacity factors
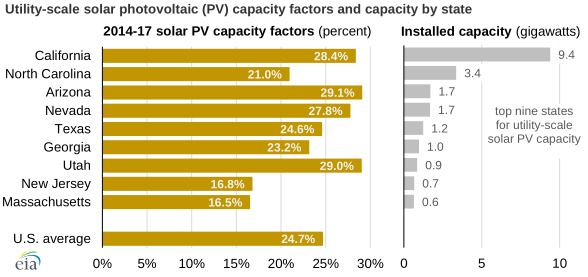
On average, utility-scale solar photovoltaic (PV) power plants in the United States operated at about 25% of their electricity generating capacity, based on an average of annual values from 2014 through 2017. This measurement, known as a plant’s capacity factor, is based on the plant’s electricity generation as a percentage of its summer capacity value for plants with a full-year of operation, as expressed in terms of alternating current (AC) power. States in the Southwest United States tend to have better solar resources—and higher capacity factors—than those in the Southeast or Northeast.
Arizona’s utility-scale solar PV plants performed better than those in any other state, achieving a 29.1% capacity factor from 2014 through 2017. Arizona’s installed utility-scale solar PV capacity was 1.7 gigawatts (GW) at the end of 2017, about 7% of the national total. Utah’s 0.9 GW of solar PV plants ranked second, with a 29.0% capacity factor. California’s utility-scale solar PV plants—totaling 9.4 GW, or 37% of the national total—ranked third with an average capacity factor of 28.4%.
By comparison, states in the Southeast, such as Georgia and North Carolina, had substantially lower PV capacity factors than southwestern states at similar latitudes. States in the Northeast, such as New Jersey and Massachusetts, had even lower capacity factors.
Three main factors largely determine a solar PV power plant’s capacity factor: resource quality, tracking capabilities, and inverter-sizing considerations. Sunnier locations, such as in the southwestern United States, have more hours of direct, high-angle sunlight per year, and as a result, the solar PV modules can capture more sunlight.
The addition of equipment to track the sun’s angle, either within a day (single-axis tracking) or across seasons (dual-axis tracking), further helps to maximize energy input into the PV system. Larger inverters—which convert the direct current produced by solar PV panels to grid-ready AC power—can also help to increase the total output of a system.
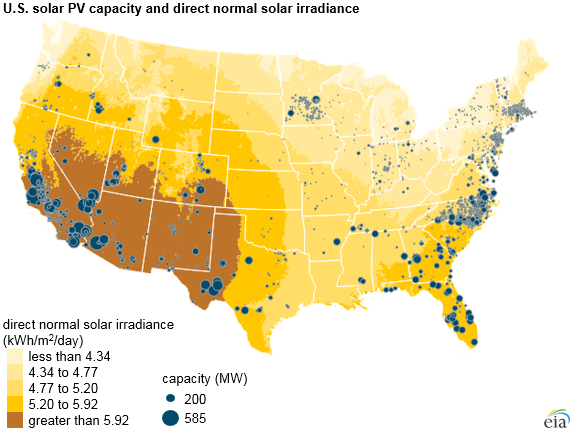
Note: kWh/m2/day is kilowatthours per square meter per day; MW is megawatt
Principal contributors: Fred Mayes, Chris Namovicz
Tags: capacity factor, solar, map