
Nearly half of utility-scale capacity installed in 2017 came from renewables
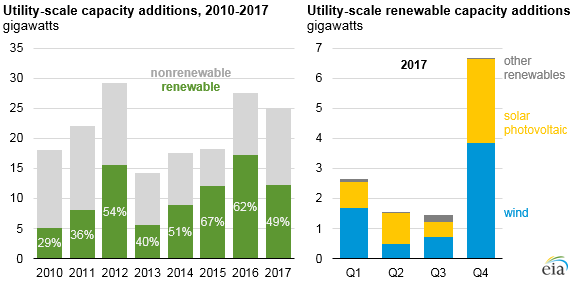
Once final data are in, EIA expects about 25 gigawatts (GW) of new utility-scale electric generating capacity to have been added to the power grid during 2017, nearly half of which use renewable technologies, especially wind and solar. Another 3.5 GW of small-scale solar net capacity additions are estimated to have come online in 2017.
Of the renewable capacity additions in 2017, more than half came online during the fourth quarter. Renewable capacity additions are often highest in the final months of the year, in part because of timing qualifications for federal, state, or local tax incentives. Estimated fourth-quarter capacity additions for 2017 are based on planned additions reported to EIA and are subject to change based on actual project completions.
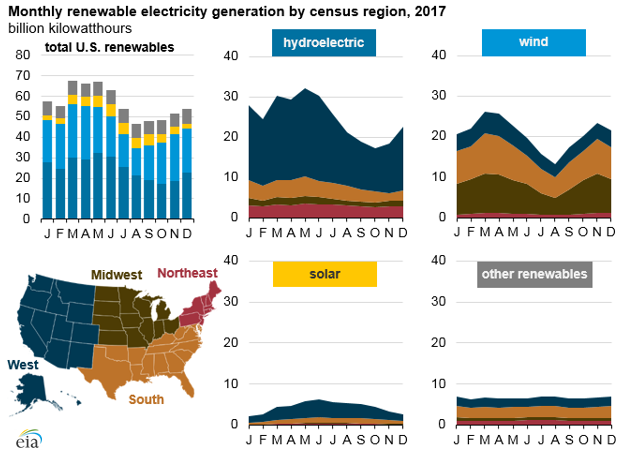
Monthly U.S. renewable electricity generation peaked in March at 67.5 billion kilowatthours, or 21% of total utility-scale electricity generation. In late spring, the melting snowpack from a winter characterized by higher-than-average levels of precipitation increased hydroelectric generation, while strong wind resources in March also produced a peak in monthly wind generation for the year.
Most renewable generation in 2017 came from the Western census division, which accounted for the majority of the hydroelectric (67%) and solar (69%) generation. Wind generation was more evenly spread across the country in 2017, with 37% occurring in the Midwest, 37% in the South, 21% in the West, and the remaining 4% in the Northeast.
Other renewable electricity highlights in 2017
- In February, Maryland increased the renewables generation target in its renewable portfolio standard (RPS) to 25% of retail electricity sales by 2020, replacing the earlier target of 20% by 2022.
- For the first time, monthly electricity generation from wind and solar (including utility-scale plants and small-scale systems) exceeded 10% of total electricity generation in the United States in March.
- In early spring, California’s total solar share of gross electricity demand exceeded 50% during the mid-day hours, resulting in negative pricing.
- From March through May, U.S. monthly electricity generation from utility-scale renewable sources exceeded nuclear generation for the first time since July 1984.
- On August 21, a solar eclipse obscured the sunlight needed to generate electricity at approximately 1,900 utility-scale solar photovoltaic (PV) power plants in the United States. Solar power output in the California Independent System Operator (CAISO) region fell to a low of 3.6 GW during maximum obscuration, about 60% lower than normal.
Principal contributor: Cara Marcy
Tags: capacity, electricity, hydroelectric, renewables, solar, utility, wind