Spark Spread
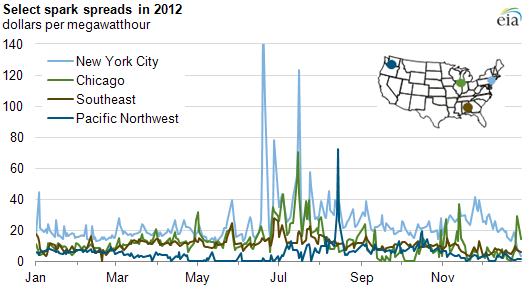
Source: U.S. Energy Information Administration, based on
SNL Energy.
The spark spread is a common metric for estimating the profitability of natural gas-fired electric generators. The spark spread is the difference between the price received by a generator for electricity produced and the cost of the natural gas needed to produce that electricity. It is typically calculated using daily spot prices for natural gas and power at various regional trading points.
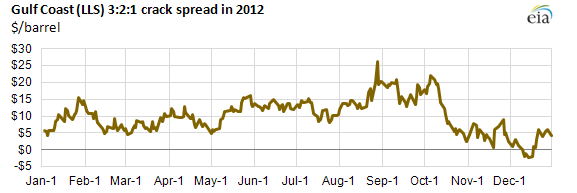
The chart above shows spark spreads during 2012, calculated for four locations around the United States. Spark spreads tend to be fairly volatile, more so than crack spreads in petroleum markets, largely because of the volatility of wholesale electric power prices, which vary widely with changes in demand for electricity and the available electric supply. Power prices formed in Regional Transmission Organizations (New York City and Chicago in the chart above) tend to be spikier than those formed in markets featuring bilateral trading between market participants (Pacific Northwest and Southeast).
There is also variation in average spark spread levels across regions: New York City tends to have relatively high average spark spreads, while in the Pacific Northwest, a low average spark spread reflects low average power prices (because of an abundance of low-cost hydropower, particularly in the late spring and early summer). Note that spark spreads are not reported if they have negative values.
Spark spread calculation. Spark spreads are calculated using the following equation:
Spark spread ($/MWh) = power price ($/MWh) – [natural gas price ($/mmBtu) * heat rate (mmBtu/MWh)]
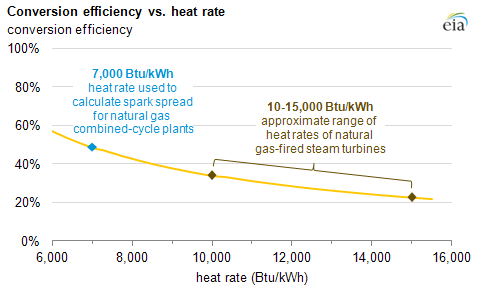
A key component of the spark spread equation is the heat rate, or measure of efficiency, of a generating unit. Those marketing the output of a unit will use the unit's tested heat rate to assess its profitability. Market participants and observers rely on a generic benchmark to assess overall market conditions. For this price table, EIA shows the spark spread using a benchmark heat rate of 7,000 Btu/kilowatthour (kWh), which represents a fairly new and efficient natural gas combined-cycle generator. One kWh has a heat content of 3,412 Btu. A generator that uses 7,000 Btu to produce one kWh has a conversion efficiency slightly below 50% (see chart below). Less efficient units have higher heat rates, and therefore require more natural gas to produce a kWh of electricity. A combined-cycle unit, which combines a combustion turbine with a steam turbine, is more efficient than a steam turbine alone.
Source: U.S. Energy Information Administration
The most efficient natural gas combined-cycle power plants have heat rates somewhat below 7,000 Btu/kWh; the spark spread for such units would be larger than the value shown here. Conversely, as a generating unit's efficiency decreases, the spark spread also decreases—thus, older, less-efficient plants have smaller spark spreads than those achieved with a heat rate of 7,000 Btu/kWh because they require more fuel per unit of output. Generators burning other fuels have similar metrics; for example, dark spreads (electricity price minus the cost of coal) are calculated for coal-fired generators, and quark spreads (electricity price minus the cost of enriched uranium fuel) for nuclear generators.
A limitation of the spark spread calculation is that it does not take into consideration other costs associated with the generation of electricity, such as pipeline costs or fuel-related finance charges, and other variable costs (like operations and maintenance costs), taxes, or fixed expenses. In that sense, a spark spread is an indicator of market conditions, but it is not necessarily an exact measure of profitability for any one specific generator.
Updated: 4/18/2013