U.S. Energy Information Administration logo
Skip to sub-navigation
February 4, 2013

U.S. household expenditures for gasoline account for nearly 4% of pretax income
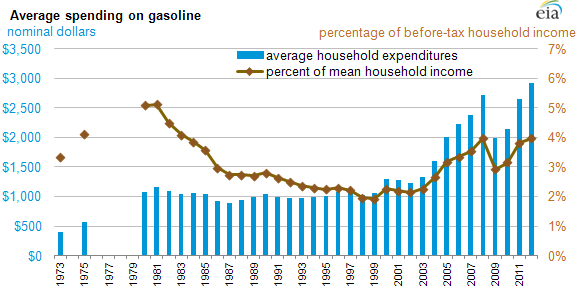
Graph of average spending on gasoline, as explained in the article text
Source: U.S. Energy Information Administration estimates, based on data from EIA, U.S. Bureau of Labor Statistics, and U.S. Census Bureau.

Republished: February 15, 2013: To correct the data source of the graph.

Republished: February 12, 2013: To correct a data source in the text.

Republished: February 4, 2013, 10:00 a.m.: To correct an error in the text.

Gasoline expenditures in 2012 for the average U.S. household reached $2,912, or just under 4% of income before taxes, according to EIA estimates. This was the highest estimated percentage of household income spent on gasoline in nearly three decades, with the exception of 2008, when the average household spent a similar amount. Although overall gasoline consumption has decreased in recent years, a rise in average gasoline prices has led to higher overall household gasoline expenditures. However, these expenditures as a percentage of overall household income are still low when compared to the early 1980s, when the estimated portion of household income spent on gasoline surpassed 5%. Although travel per household has increased significantly since the early 1980s, vehicle efficiency has also risen significantly, reducing the amount of gasoline used per mile.

Efficiency gains have accelerated in recent years, such that total U.S. gasoline consumption fell in 2011 to 134.2 billion gallons, its lowest level since 2001. However, at the same time, Bureau of Labor Statistics's average city retail gasoline price rose 26.1% in 2011, and another 3.3% in 2012, when it reached $3.70 per gallon. The effect of the higher prices in 2011 and 2012 outweighed the effect of reduced consumption. As a result, expenditures increased to a record annual average of $2,655 per household in 2011, rising to an estimated $2,912 in 2012. The 26.1% yearly increase in 2011 was six times greater than the 3.4% rise in nominal household income. Additionally, the 3.3% estimated gasoline price rise in 2012 outpaced the 2.9% estimated increase in income.

Statistics
Analysis
Tools
Education
News

Petroleum & Other Liquids

Crude oil, gasoline, heating oil, diesel, propane, and other liquids including biofuels and natural gas liquids.

Natural Gas

Exploration and reserves, storage, imports and exports, production, prices, sales.

Electricity

Sales, revenue and prices, power plants, fuel use, stocks, generation, trade, demand & emissions.

Coal

Reserves, production, prices, employment and productivity, distribution, stocks, imports and exports.

Nuclear & Uranium

Uranium fuel, nuclear reactors, generation, spent fuel.

Renewable & Alternative Fuels

Includes hydropower, solar, wind, geothermal, biomass and ethanol.

EIA Survey Forms

Forms EIA uses to collect energy data including descriptions, links to survey instructions, and additional information.

Total Energy

Comprehensive data summaries, comparisons, analysis, and projections integrated across all energy sources.

U.S. States

State energy information, including overviews, rankings, data, and analyses.

International

International energy information, including overviews, rankings, data, and analyses.

Environment

Greenhouse gas data, voluntary reporting, electric power plant emissions.

Data Tools, Apps, & Maps

Tools to customize searches, view specific data sets, study detailed documentation, and access time-series data.

Open Data

EIA's free and open data available as API, Excel add-in, bulk files, and widgets

EIA Beta

Come test out some of the products still in development and let us know what you think!

Open Source Code

EIA's open source code, available on GitHub.

RSS Feeds

Subscribe to feeds for updates on EIA products including Today in Energy and What's New.