
Oil flows through Middle East chokepoints increased in the third quarter
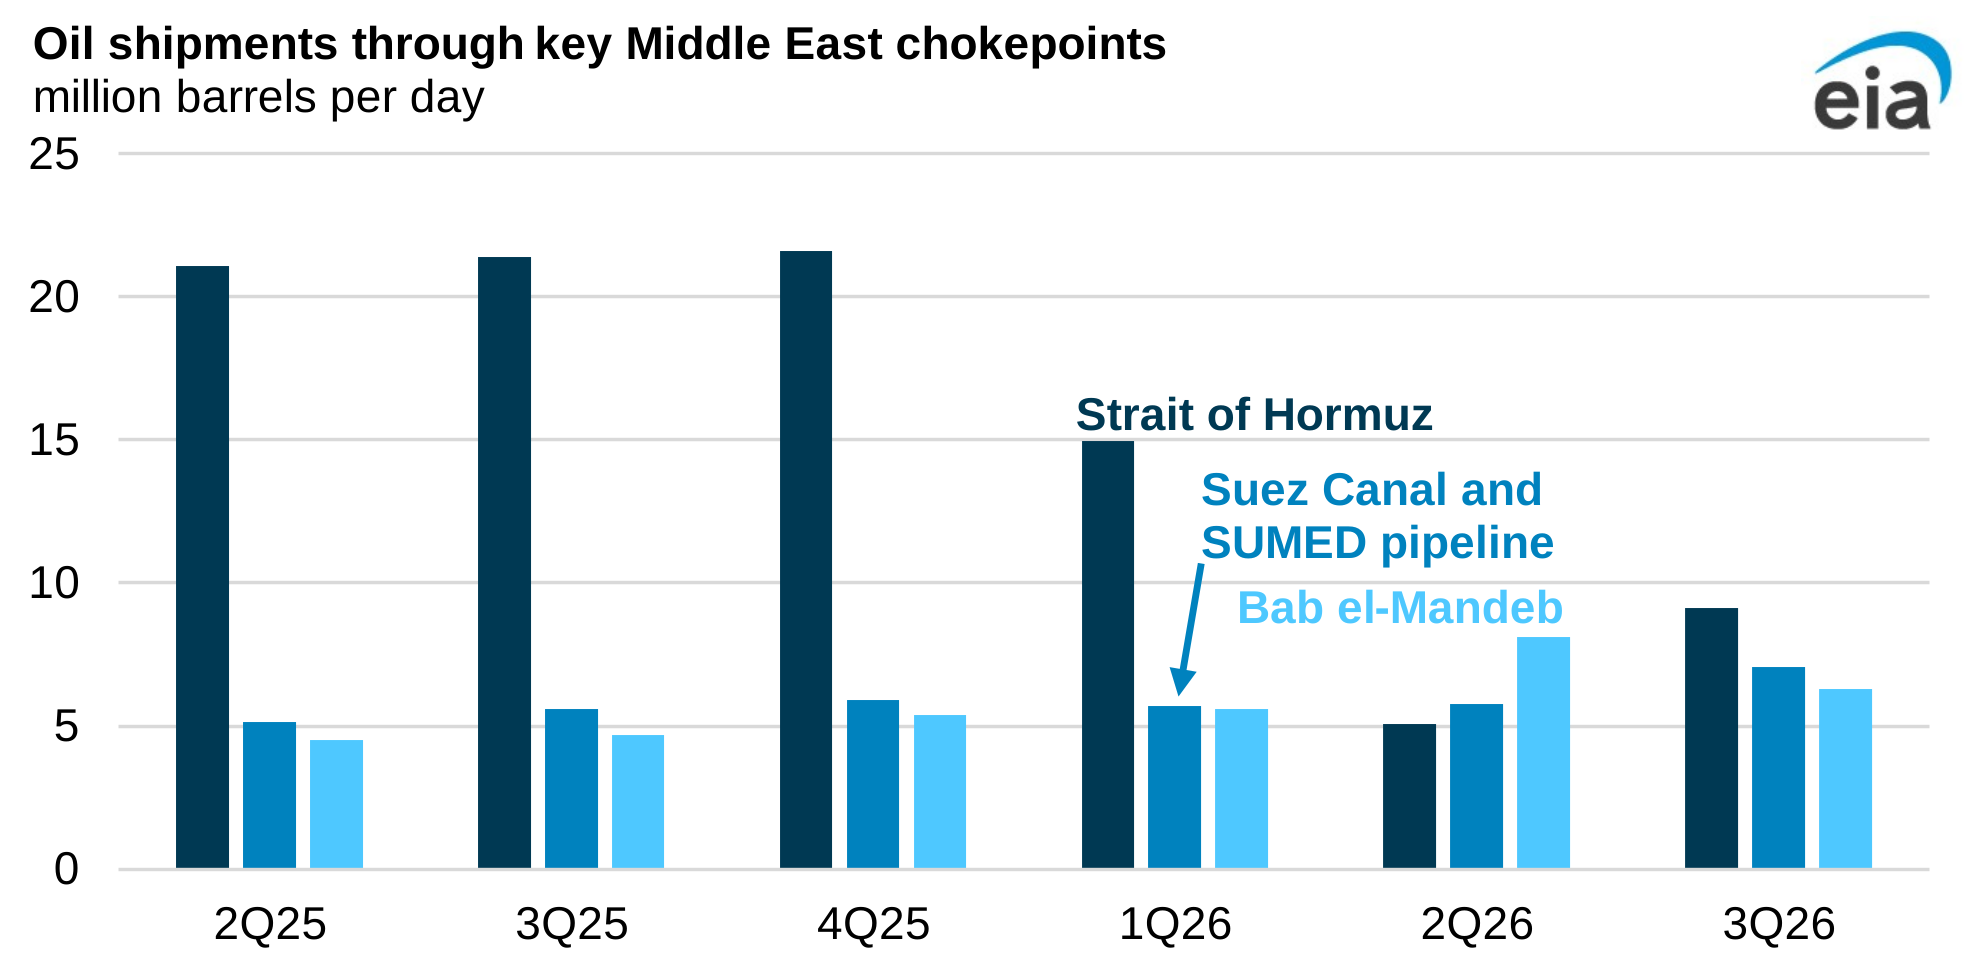
Note: Data are for total crude oil and petroleum products and are the sum of flows through the Strait of Hormuz, Bab el-Mandeb, and Suez Canal/SUMED pipeline. Data include oil originating from Middle Eastern countries and other countries. 1Q25=first quarter of 2025
Collective oil shipments through key chokepoints around the Middle East increased by 19% in the third quarter of 2026 (3Q26), according to our recently published Global Energy Security Data.
Oil shipments through the Strait of Hormuz and Suez Canal each increased while those through the Bab el-Mandeb decreased compared with the second quarter, when flows were severely constrained following the onset of the conflict with Iran. Flows around the Middle East increased because of the use of smaller ships to move oil out of the Persian Gulf for ship-to-ship transfers of crude oil onto VLCCs, and producers have maximized utilization of infrastructure to bypass the areas of highest risk. Initial shipping data from Vortexa show that shipments remained close to 3Q26 levels in October.
We estimate that countries around the Middle East produced 23.1 million barrels per day (b/d) of crude oil in October, the most since the beginning of the conflict.
Despite rising exports and more production, the Brent crude oil spot price averaged $124 per barrel (b) in October, the highest in any month since the conflict began.
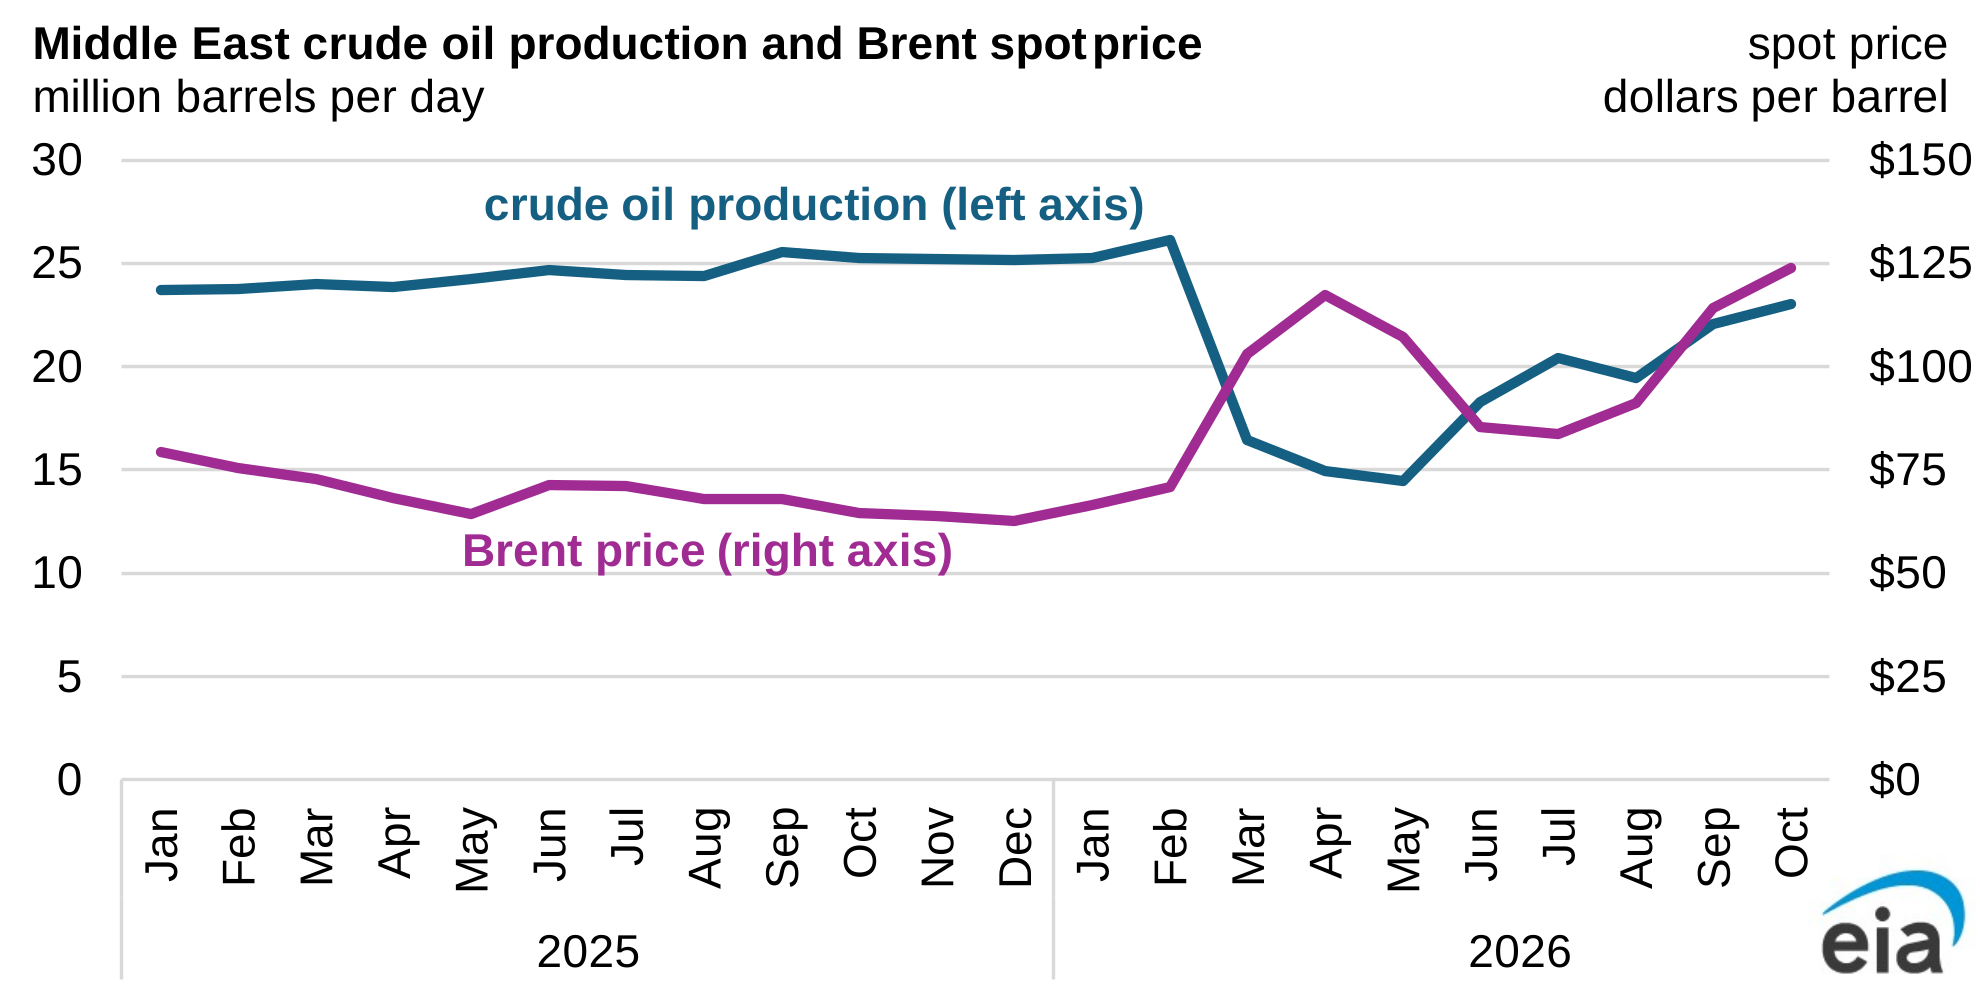
High crude oil prices amid rising production and exports from the Middle East reflect several factors.
- Lower global oil inventories: We estimate that global oil inventories were 400 million barrels lower at the end of October than they were at the beginning of April.
- More oil consumption: The world consumed an estimated 102.8 million b/d of liquid fuels in October, up 2.8 million b/d from the 2Q26 average. In addition, shipping data from Vortexa show China imported 76% (4.7 million b/d) more crude oil and condensates in October than it did in 2Q26.
- Fewer withdrawals from strategic stocks: Supply to the market from the U.S. Strategic Petroleum Reserve (SPR) peaked in 2Q26 at more than 1 million b/d. However, those draws slowed to almost zero during October. Other OECD countries also released strategic stocks as part of the International Energy Agency’s (IEA) collective action announced in March, with most of these volumes reaching market in 2Q26.
- High refining margins and runs: In the United States, wholesale diesel’s premium to Brent averaged $82/b in October, up from an average of $57/b in 2Q26. Spot price data from Bloomberg also show increases in Europe over the same period; these increases encouraged refineries to purchase more crude oil and run at high rates.
As of November 18, however, the Brent crude oil spot price has fallen more than $30/b from the October monthly average. Steadily increasing flows through the Strait of Hormuz have helped push prices down.
In our November Short-Term Energy Outlook, we forecast that Brent will average $99/b in December and $86/b next year. Given the recent increase in exports and production from the Middle East, we estimate global oil inventories have begun to increase. We also forecast that oil demand will remain relatively flat in the near term, averaging 102.8 million b/d in 1Q27.
Additionally, we expect more barrels from strategic stocks will hit the market. On September 29, the U.S. Department of Energy announced an exchange that would offer 40 million barrels of crude oil from the U.S. SPR for delivery to market in November and December. On October 15, the IEA announced it would deliver remaining committed strategic volumes to market.
Principal contributors: EIA Staff
Tags: chokepoints