
Hydropower generation in the Southwest fell to record lows this summer
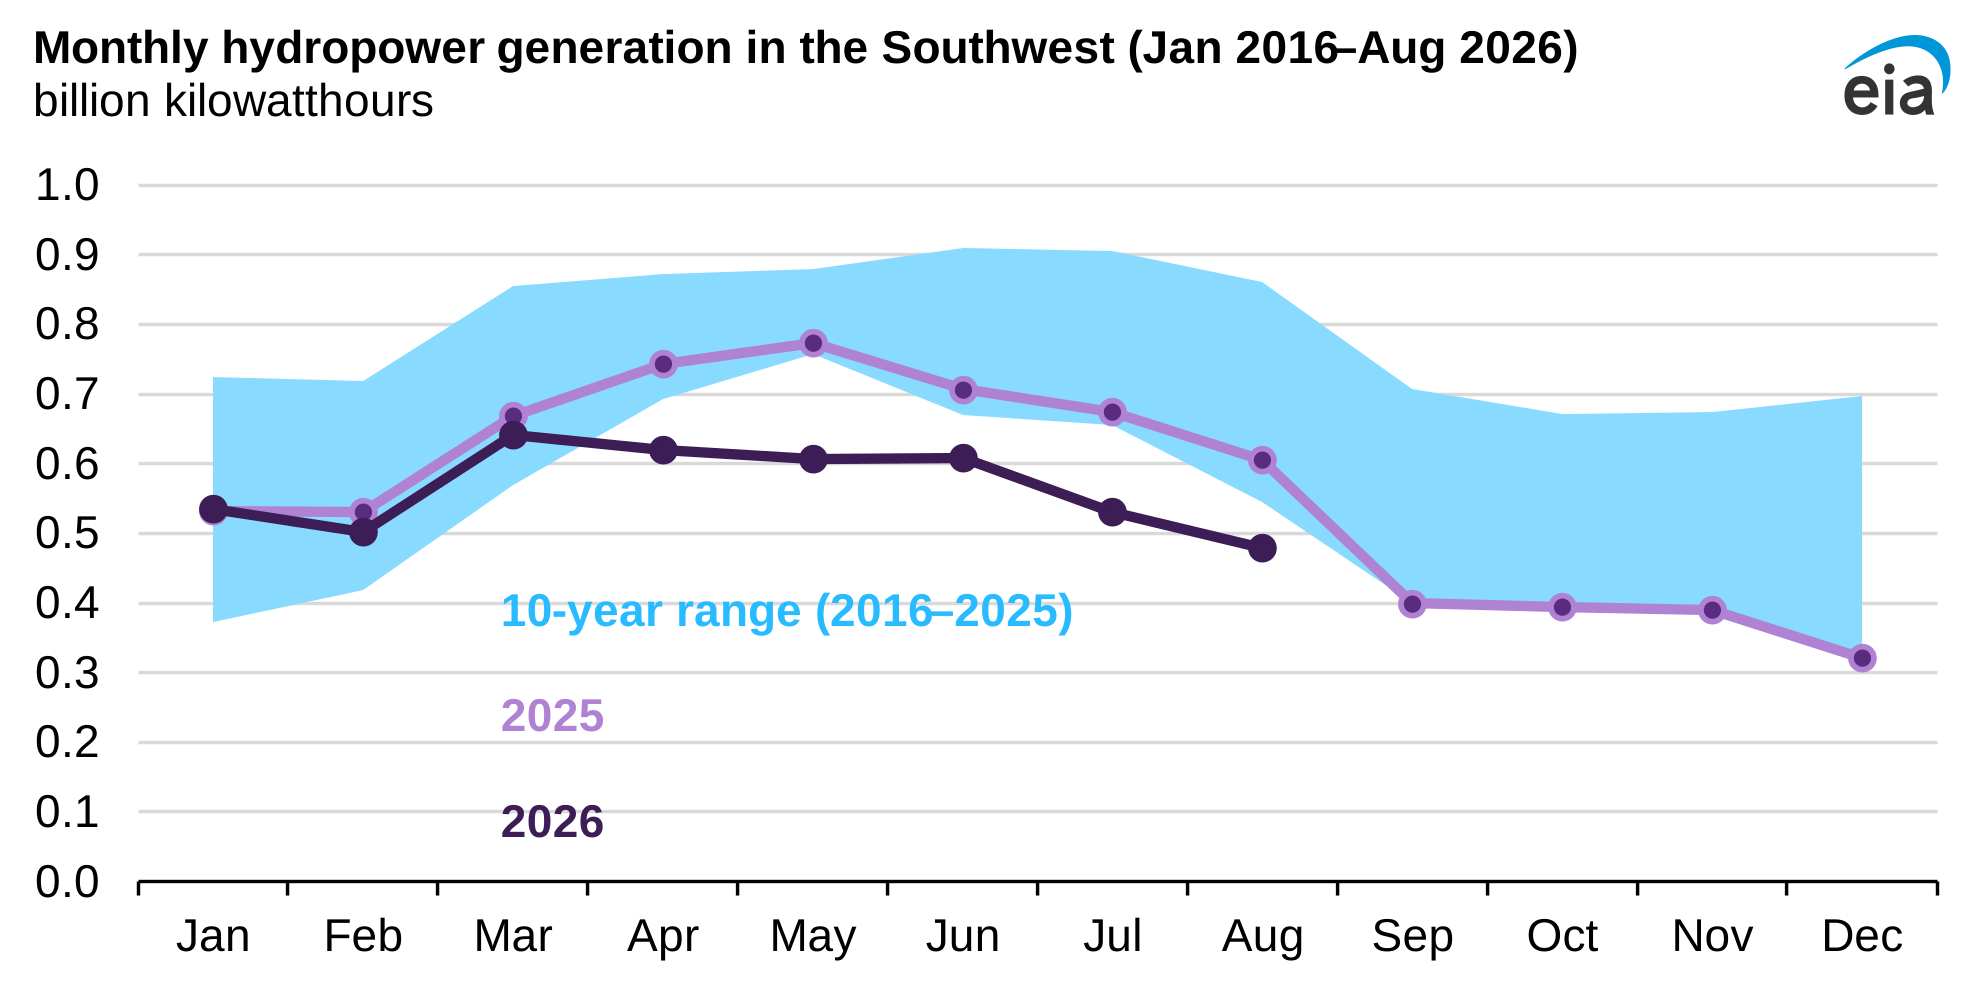
Prolonged drought conditions affecting the Colorado River Basin led to record low hydropower generation this summer in the Southwestern electricity supply region, which includes Arizona, New Mexico, and small parts of Nevada and California. Hydropower generation from April through August 2026 was 19% lower than during the same period last year and 28% lower than the 10-year average, according to the latest data from our Form EIA-923 survey.
Water elevations at Lake Powell and Lake Mead, which are formed by the Glen Canyon Dam and Hoover Dam, respectively, hit record lows. To be able to generate hydropower at the Glen Canyon Dam, Lake Powell should have an elevation of at least 3,490 feet, also known as the minimum power pool. At the end of September, this elevation reached 3,518 feet, less than 1% above minimum power pool. The Hoover Dam requires an elevation of at least 950 feet at Lake Mead, which by the end of September reached 1,038 feet, 9% higher than minimum power pool. The U.S. Bureau of Reclamation manages most dams across the Colorado River Basin. Seven states (Arizona, California, Colorado, Nevada, New Mexico, Utah, and Wyoming) depend on the river for hydropower generation and for other water supply needs. To mitigate the risk of Lake Powell’s water elevation falling below the minimum power pool, water was released from Flaming Gorge, a reservoir located in the Upper Colorado River Basin. Additionally, water releases from Lake Powell were reduced to maintain an elevation of at least 3,510 feet given the most probable water inflows.
However, lower water releases from Lake Powell could also impact water elevation downstream at Lake Mead, in turn affecting hydropower generation at the Hoover Dam. To address this possibility, the Department of the Interior decided to reduce the collective water consumption of California, Arizona, and Nevada by 1.25 million acre-feet each year over the next two years.
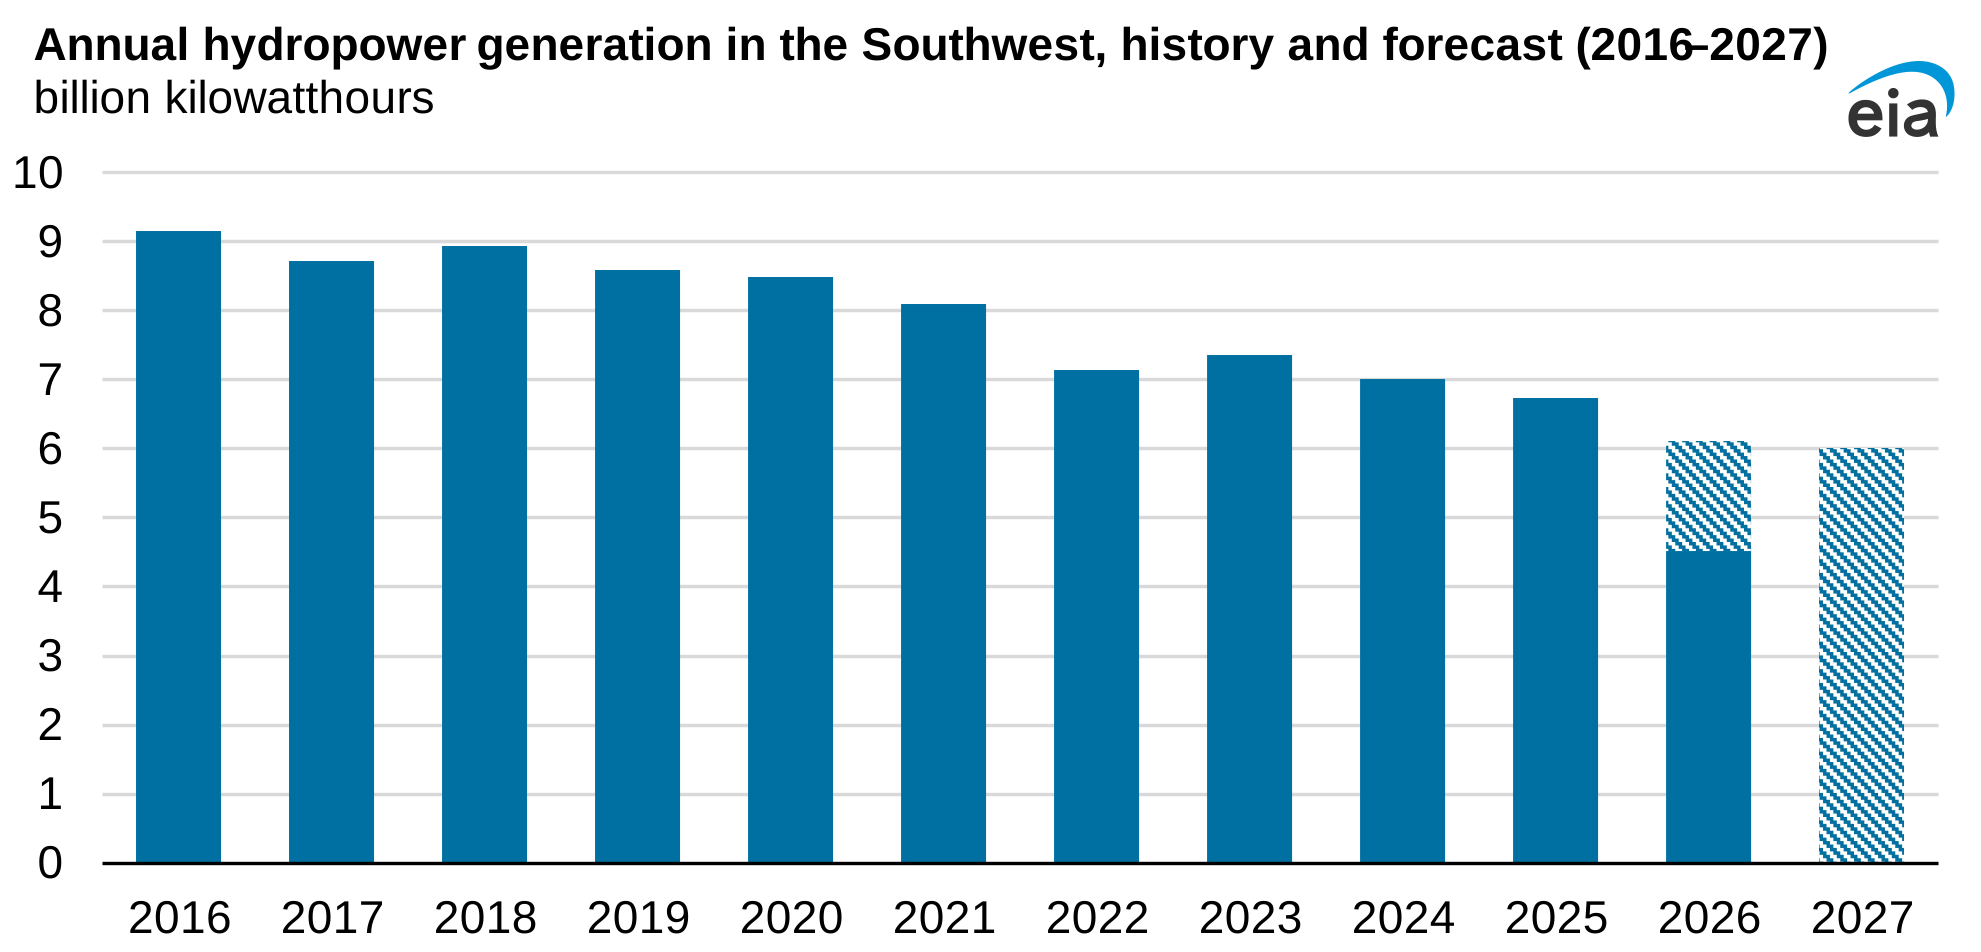
We expect hydropower generation in the Southwest will total 6.13 billion kilowatthours (BkWh) in 2026 in our November Short-Term Energy Outlook (STEO), 9% lower than last year and 24% lower than the 10-year average. In 2027, we expect hydropower generation in the Southwest to total 6.1 BkWh, 0.5% lower than this year. This year’s El Niño could bring more precipitation than normal, providing some drought relief and improving the hydropower generation forecast in the region. However, one good water year likely won't eliminate the effects of multiple years of water scarcity.
According to the STEO, hydropower generation in the Southwest is expected to account for about 4% of the region's generation mix in 2026. That share has declined from a peak of 8% in 2011.
Principal contributor: Lindsay Aramayo