
Global refinery inputs fell sharply in the second quarter of 2026 before modest recovery
Note: 2Q2025=second quarter of 2025
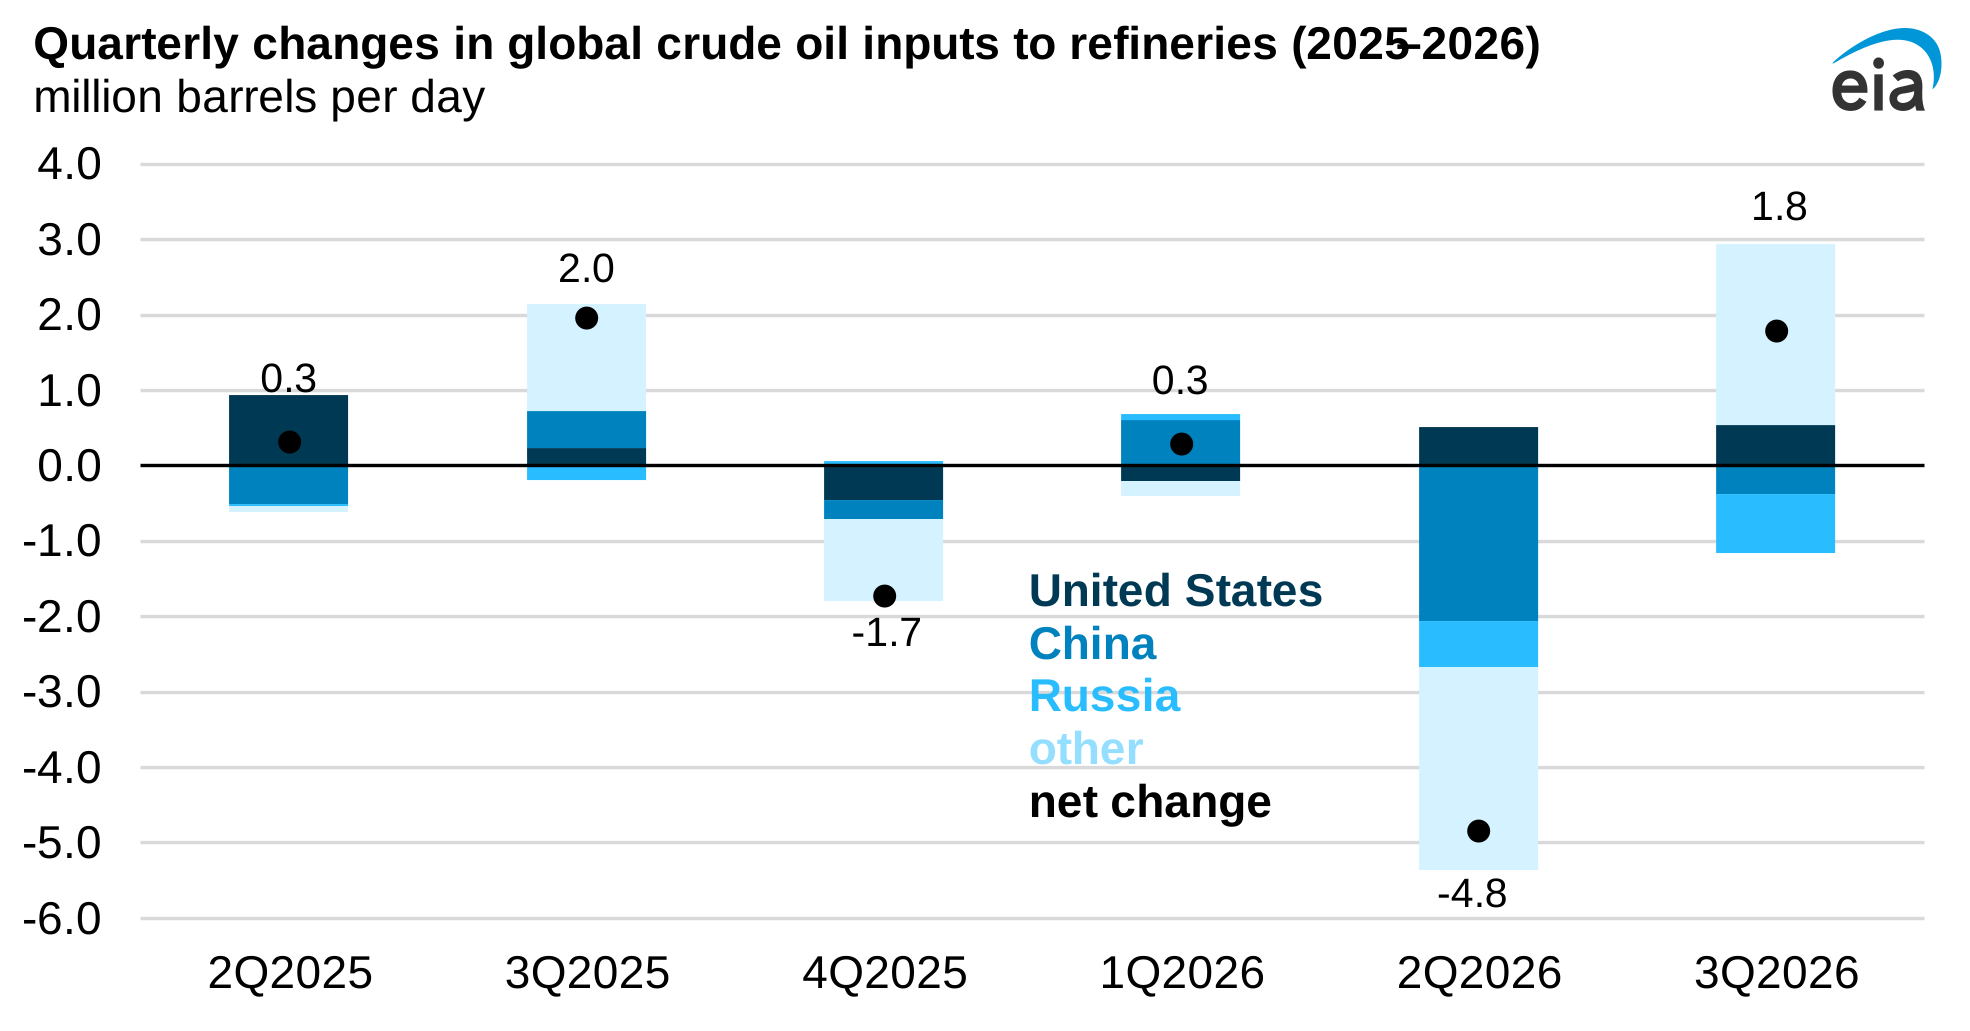
Global crude oil refinery inputs fell by 4.8 million barrels per day (b/d) in the second quarter of 2026 (2Q26), or 6%, following the start of conflict in late February in the Middle East, according to data from Kpler. Throughput then increased by 1.8 million b/d in the third quarter, primarily as refiners in the region adjusted to new trade flows.
Crude oil inputs to refineries typically increase in the second and third quarters of the year as refiners complete planned maintenance and gear up to meet peak seasonal demand for refined products, such as gasoline and jet fuel. Global crude oil inputs increased by 0.3 million b/d in the second quarter of 2025 and by another 2 million b/d in the third quarter.
The countries with the largest refining capacity in the world are the United States, China, Russia, and India. Refining in countries most directly impacted by the loss of crude oil supply from conflict in the Strait of Hormuz saw the largest declines. Crude oil refinery inputs in China fell by 2.1 million b/d in 2Q26 and by an additional 0.8 million b/d in 3Q26, while crude oil inputs in India, South Korea, and Japan fell by more than 1.0 million b/d collectively in 2Q26 before rebounding by 0.8 million b/d in 3Q26.
Crude oil inputs also fell in the Middle East as the closure of the strait significantly limited the export of refined products. Crude oil inputs fell by 0.7 million b/d in Kuwait, 0.7 million b/d in the United Arab Emirates, 0.3 million b/d in Saudi Arabia, and 0.2 million b/d in Iran in 2Q26. Total crude oil inputs in these four countries increased by 0.4 million b/d in 3Q26.
Increased attacks on Russian oil infrastructure during the ongoing conflict between Russia and Ukraine reduced refinery crude oil inputs in Russia by 0.6 million b/d in 2Q26 and an additional 0.8 million b/d in 3Q26. Russia is a major fuel exporter, especially of diesel fuel, so the decline in exports affected global diesel markets that were already tight from earlier geopolitical developments. This loss in refinery operations compounded reduced refining activity in Asia and the Middle East, contributing to diesel prices increasing to the highest nominal levels on record in September.
Although crude oil inputs were falling in some countries in the second and third quarters of 2026, they increased in the United States and in some other regions that were able to find alternative sources of supply. Crude oil refinery inputs in the United States increased by 0.5 million b/d in 2Q26 and by an additional 0.5 million b/d in 3Q26, as the United States increasingly exported refined products around the world to make up for lost supply.
Global refinery crude oil inputs recovered somewhat in 3Q26, increasing by 1.8 million b/d overall as increased flows through the Strait of Hormuz, alternative routes, and ship-to-ship transfers put more Middle Eastern crude oil on the global market. Despite the increase in oil flows and refinery inputs, crude oil inputs in 3Q26 still remained about 5% lower on average than during the same period of 2025.
Principal contributor: Sean Hill
Tags: refineries, international