
Coal distributions for non-electric power use decline in the South
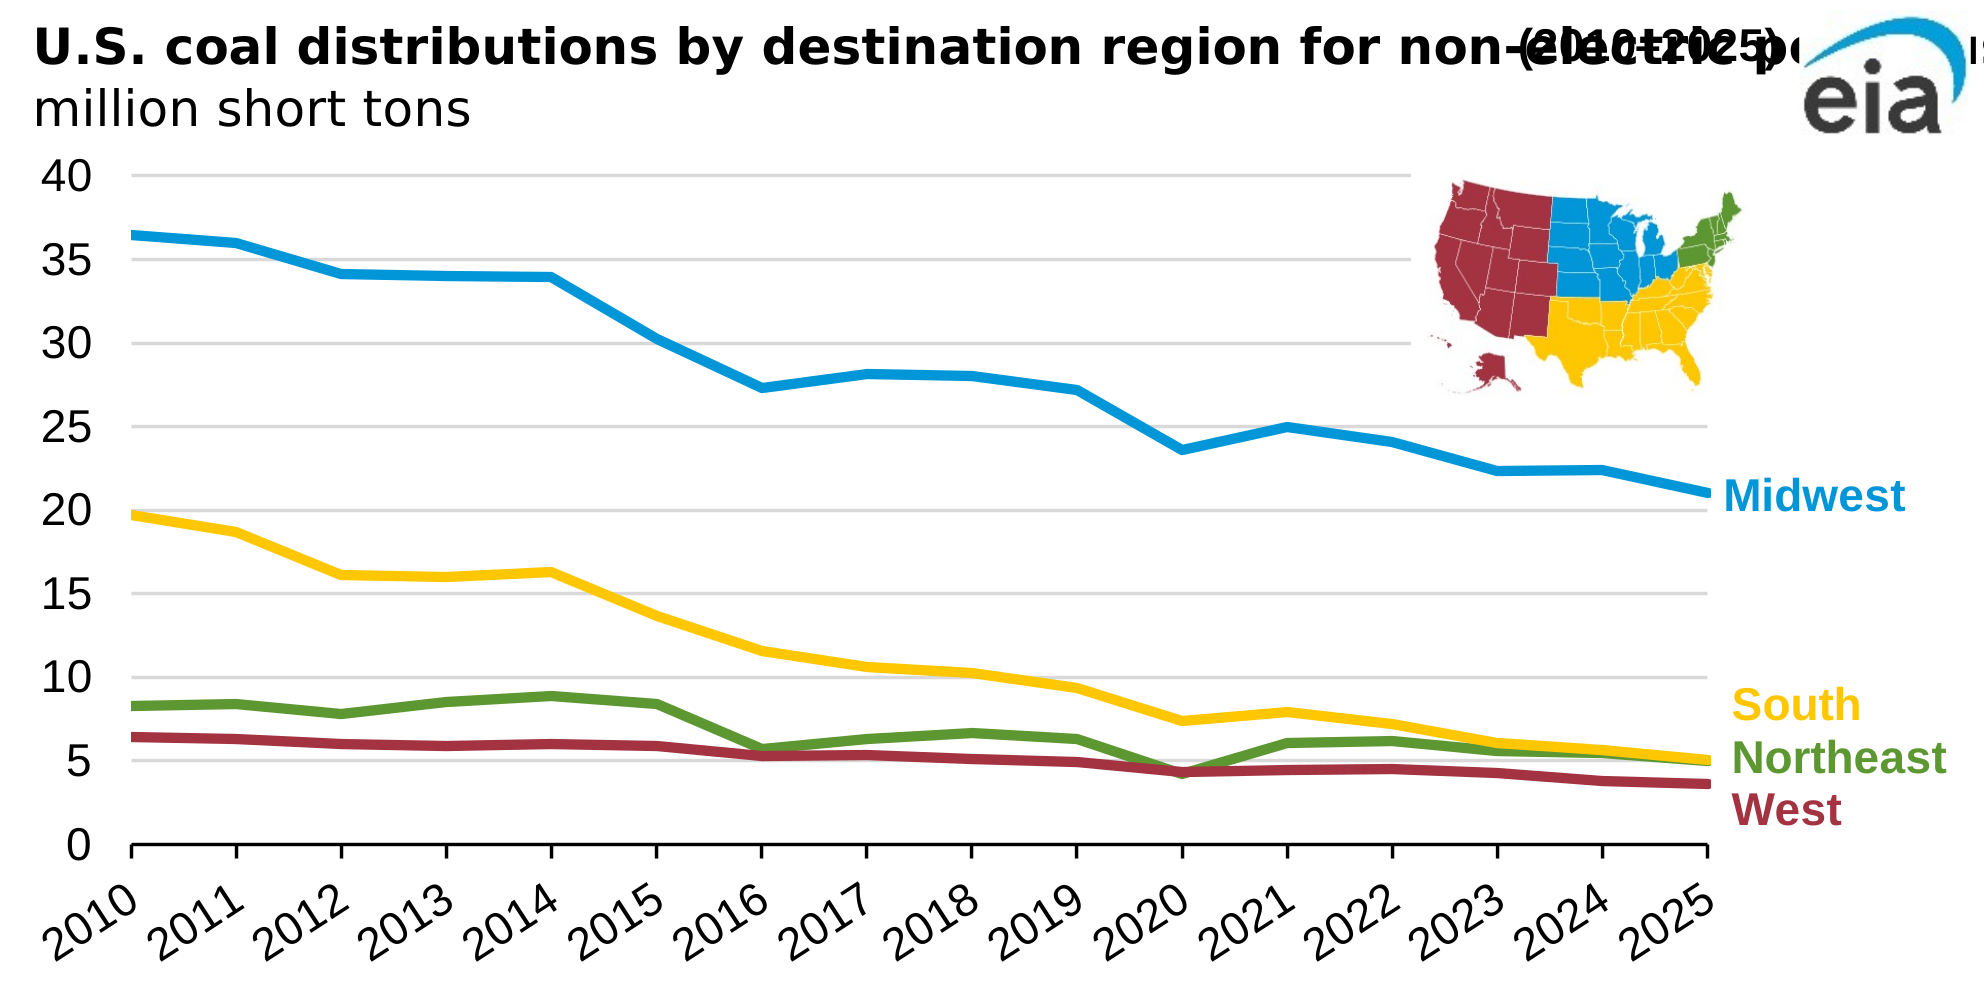
Note: The 2025 data points are annualized using the four quarters of preliminary 2025 data from the Quarterly Coal Distribution Report. The Annual Coal Distribution Report provides detailed information about domestic coal distribution by, coal-origin state coal-destination state, consumer category, and method of transportation. It also summarizes foreign coal distribution by coal-producing state.
The volume of coal delivered in the United States for uses other than power generation—primarily, for manufacturing—decreased by about half in the last 15 years. Coal delivered for these purposes in the South decreased the most in percentage terms between 2010 and 2025, falling 75%, or 14.7 million short tons (MMst), according to our Annual Coal Distribution Report and Quarterly Coal Distribution Report. In 2010, the South received more than double the amount of coal received in the Northeast; by 2025 the two regions received about the same amount. Manufacturers’ increasing use of natural gas instead of coal and the closure of manufacturing plants using coal were major factors in this decline.
Receipts of coal in nearly all states in the South decreased relative to 2010 levels. The Appalachian coal belt states (West Virginia, Alabama, Virginia, Tennessee, Kentucky, and Georgia) had the largest volumetric decreases, averaging 1.7 MMst. In terms of percentage decline, Florida, West Virginia, Georgia, Texas, and South Carolina all had declines of 90% or greater. Only Louisiana received more coal in 2025 than 2010, increasing 775%, or 0.2 MMst. However, Louisiana’s non-electric power distributions only composed a small portion, approximately 5%, of the South’s total coal distributions in 2025.
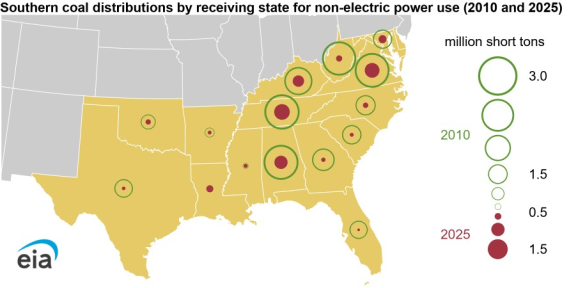
Note: The 2025 data points are annualized using the four quarters of preliminary 2025 data from the Quarterly Coal Distribution Report. Map excludes Delaware and District of Columbia due to negligible destination coal distributions.
Coal distributions in the South have been important for manufacturing, and historically, about 8% of coal distributions in the region have been used for purposes other than electric power generation. The recently released 2022 Manufacturing Energy Consumption Survey (MECS) shows the use of coal (for both fuel and feedstock use) by the U.S. manufacturing sector declined from 60 MMst in 2010 to 43 MMst in 2022, a 28% decrease. The South accounted for the largest share of this decline, falling 60% from 20 MMst in 2010 to 8 MMst in 2022. Paper industry plants, primary metals production plants (primarily iron and steel mills), chemical manufacturing plants, and coking plants were the primary industries reducing coal consumption in the South. Some of these manufacturing industries decreased operations in the region, such as with the closure of coking plants in Alabama and West Viriginia. Over the same period, these four industries increased their natural gas consumption between 16% and 200%.
Principal contributors: Kimberly Weihbrecht & Jeramiah Yeksavich
Tags: manufacturing, consumption/demand, coal, map