
Hydropower generation expected to recover despite snow drought in the West
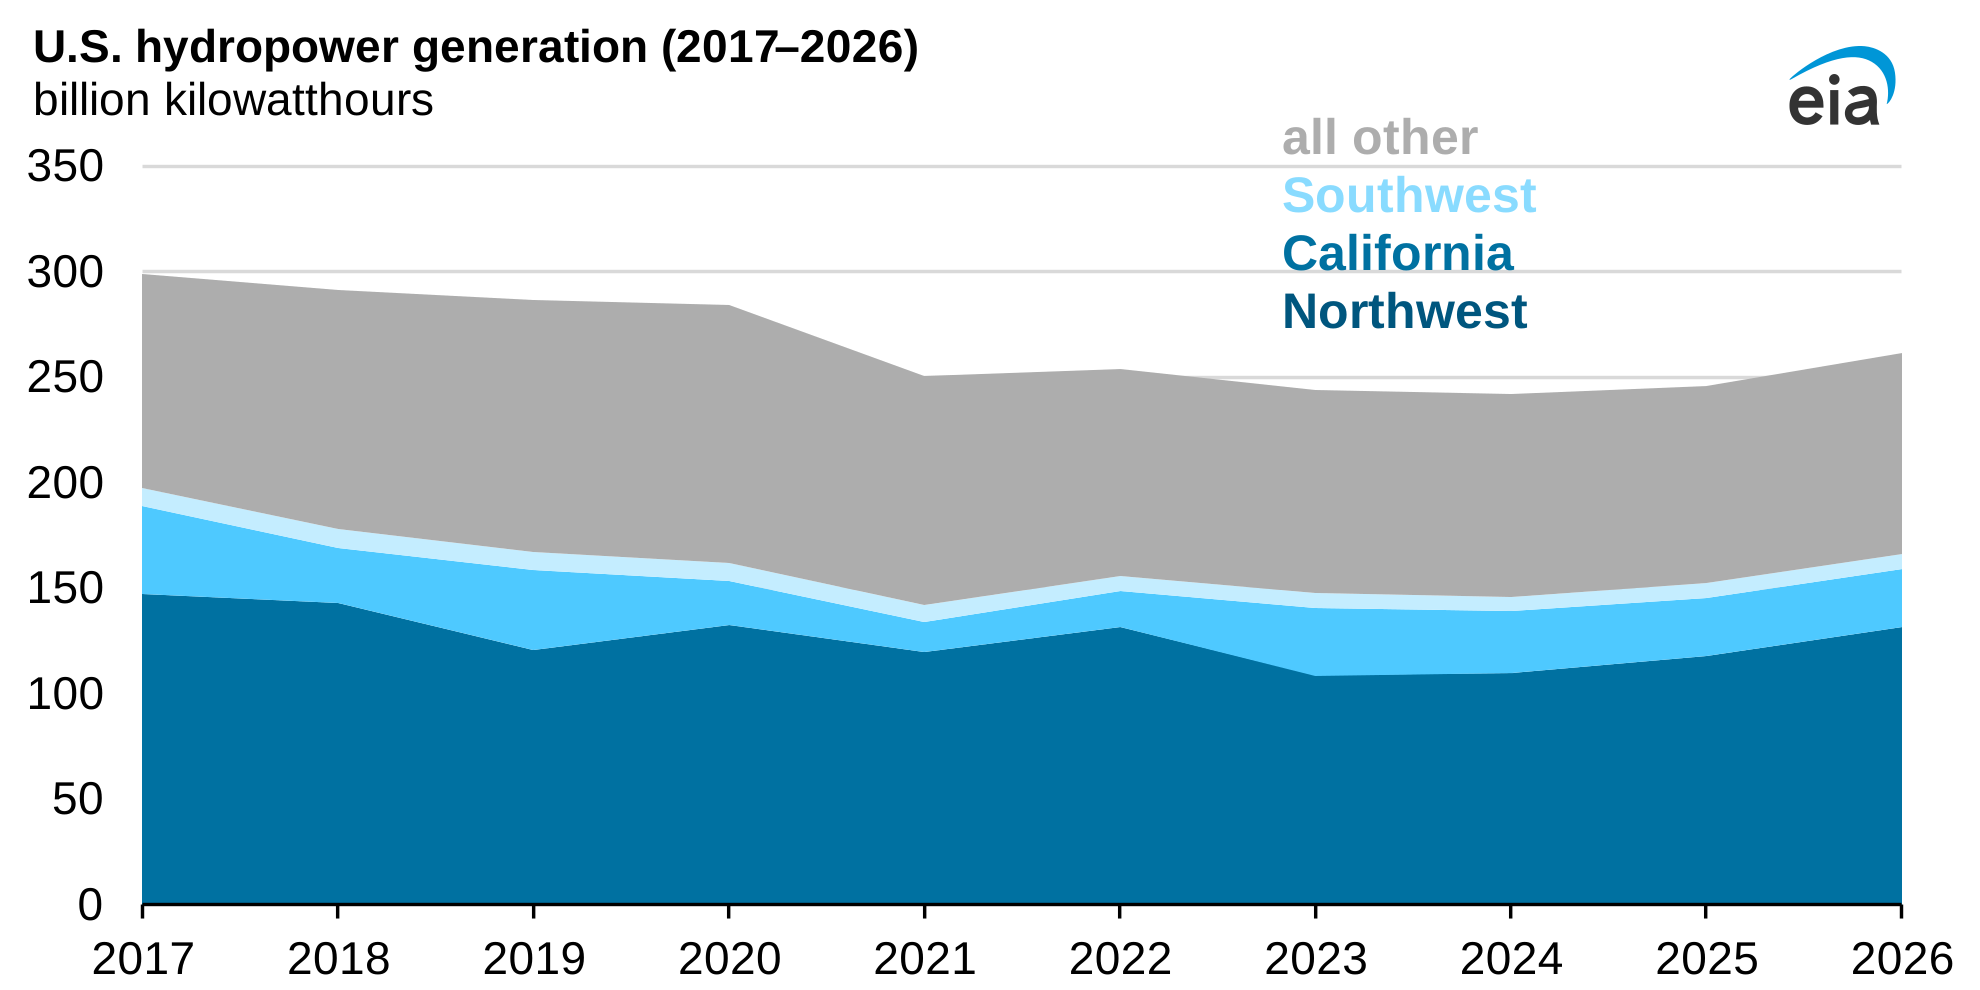
In our April Short-Term Energy Outlook (STEO), we expect U.S. hydropower generation will increase by 5% in 2026 but remain 1.8% below the 10-year average following snow drought conditions in some states. Hydropower generation in 2025 increased to 245 billion kilowatthours (BkWh), about 4 BkWh more than the record-low generation year 2024. In 2026, we expect generation will be 259 BkWh, which would represent 6% of U.S. electricity generation.
Seasonal precipitation in the form of rain and snowpack accumulation are the two main factors that help predict water supply and hydropower generation. Seasonal precipitation influences soil moisture, and moister soil helps to preserve the snowpack, which in turn acts as a natural reservoir.
According to data from the Western Regional Climate Center, precipitation levels across the western United States have been mostly normal. However, many states in this region have experienced record warm winter temperatures leading to snow drought conditions. A heat wave in March affecting much of the western United States also led to early snowmelt especially around California, the Southwest, and portions of the Northwest. These conditions will likely affect hydropower generation, as less water supply is expected in the spring and summer months.
Northwest
The Columbia River Basin in the Northwest region contains more than one-third of U.S. hydropower capacity and generates enough electricity to power over 4 million homes. Changes in water supply in the Northwest can affect the use of other electricity-generating fuels in the region, such as natural gas, and can affect electricity trade with neighboring areas.
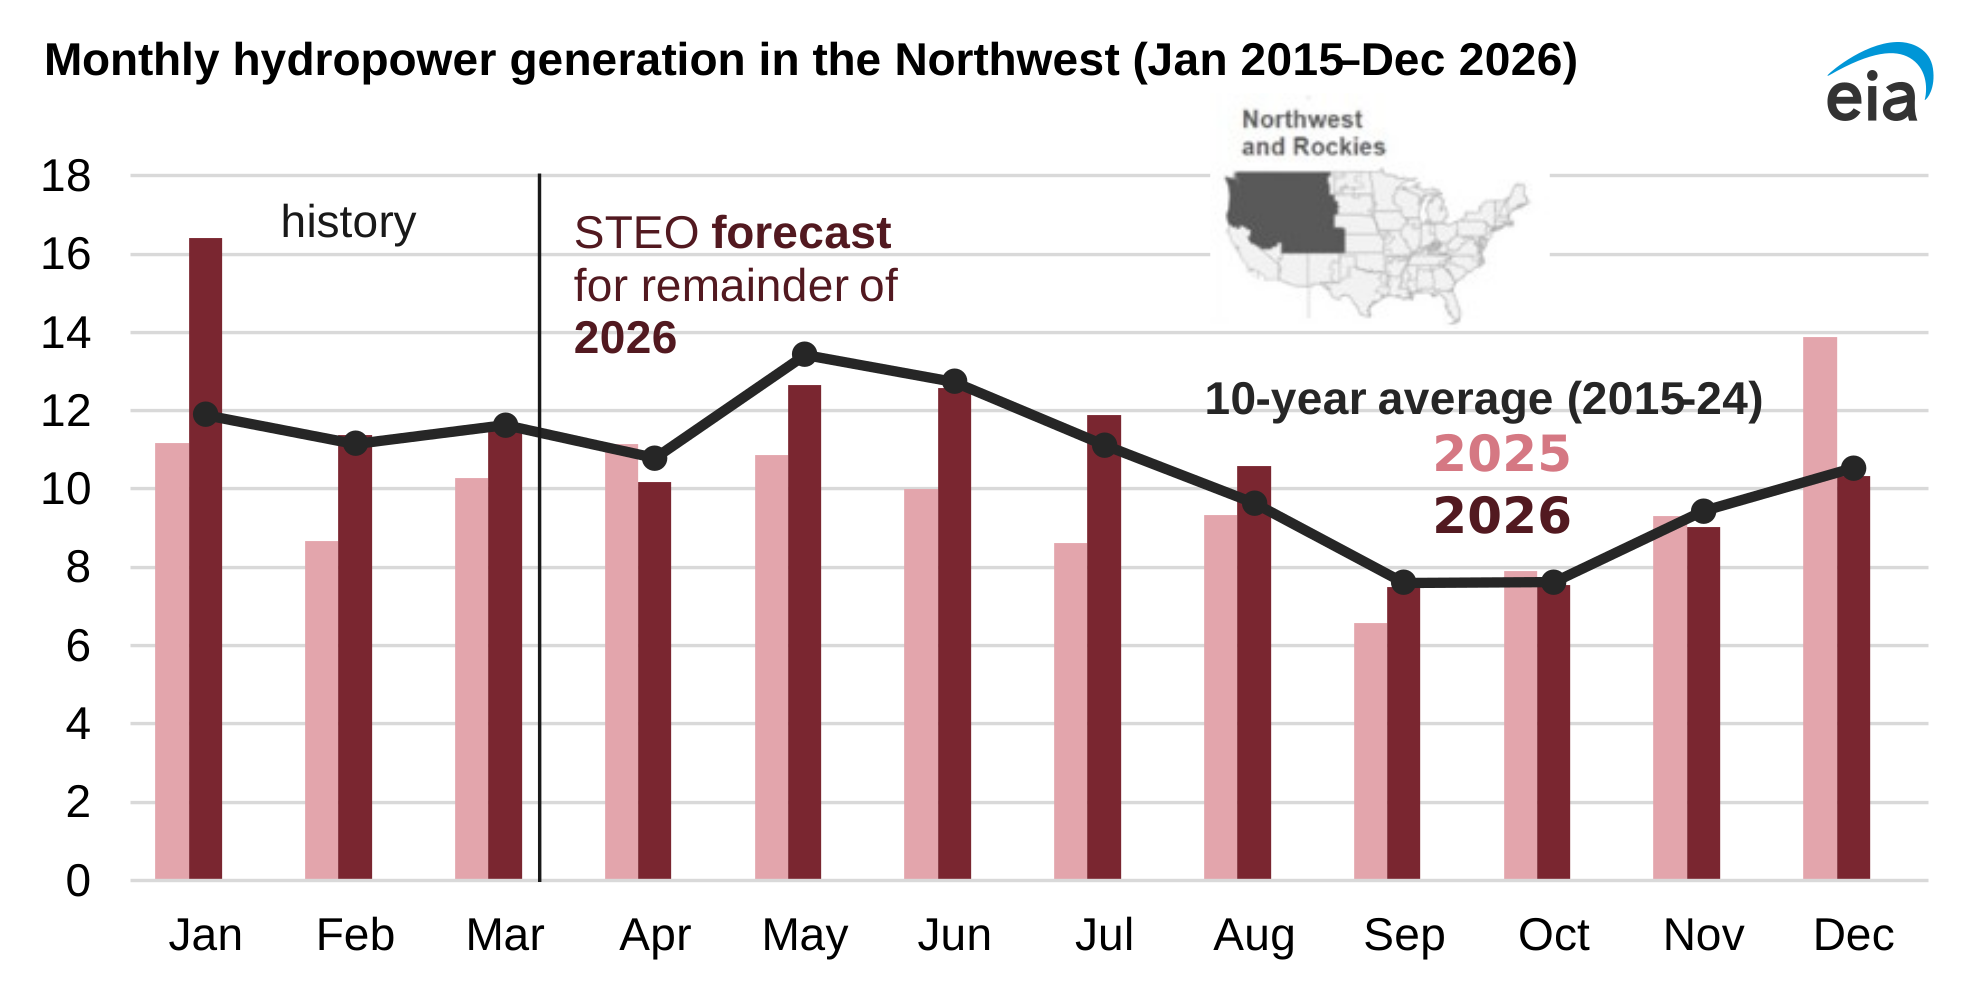
We expect hydropower generation in the Northwest and Rockies region to be 125 BkWh, which is a 17% increase compared with 2025 and 4% less than the 10-year average. Hydropower generation in December 2025 and January 2026 was unusually high due to a series of atmospheric rivers that led to devastating flooding in the region. Our hydropower forecast is informed by the water supply outlook from the National Oceanic and Atmospheric Administration’s Northwest River Forecast Center.
California
We forecast hydropower generation in California to be 28.5 BkWh in our April STEO, which is 6% less than last year’s generation but 15% more than the 10-year average.
As of April 1, reservoir levels in most major reservoirs in California were above the 30-year historical average for this time of year. The two largest reservoirs in the state, Shasta and Oroville, were at 114% and 124% of the historical average, respectively. The state of California also experienced three consecutive weeks of no drought or drier than normal conditions. However, according to the California Department of Water Resources, snowpack conditions as of April 1 were well below normal with Northern Sierra Nevada at 7%, Central Sierra at 25%, and Southern Sierra at 39%. Additionally, warmer-than-normal temperatures in March led to some early snowmelt across the state.
Principal contributor: Lindsay Aramayo
Tags: hydroelectric, electricity, generation, weather, California, states, Northwest