
U.S. electric capacity mix shifts from fossil fuels to renewables in AEO2023
From December 18 to January 1, Today in Energy will feature some of our favorite articles from 2023. Today’s article was originally published on April 13.
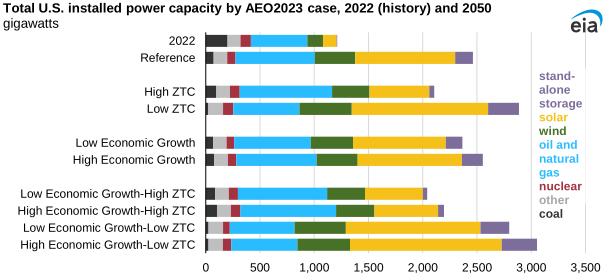
Note: ZTC=Zero-Carbon Technology Cost; other=geothermal, biomass, municipal waste, fuel cells, hydroelectric, pumped hydro storage
The U.S. power grid nearly doubles in capacity from 2022 to 2050 to meet increasing demand for electric power, and most newly built capacity will be from renewable energy technologies, according to most cases in our Annual Energy Outlook 2023 (AEO2023). Declining capital costs for solar panels, wind turbines, and battery storage, as well as government subsidies such as those included in the Inflation Reduction Act (IRA), result in renewables becoming increasingly cost effective compared with the alternatives when building new power capacity. Economic growth, paired with rising electrification in end-use sectors, results in stable growth in U.S. electric power demand through 2050.
In our AEO2023, we explore long-term energy trends in the United States and present an outlook for energy markets through 2050. We use different scenarios, called cases, to understand how varying assumptions affect energy trends. These cases include:
- The Reference case, which serves as a baseline, or benchmark, case. It reflects laws and regulations adopted through mid-November 2022, including the IRA. It assumes capital costs for power generating technologies decline over time from learning by doing as commercialization expands and construction and manufacturing experience accelerates. It also assumes the U.S. GDP annual growth rate is 1.9% over the projection period.
- The Low Zero-Carbon Technology Cost case, which assumes faster technology-cost declines for zero-carbon technologies, resulting in about a 40% cost reduction by 2050 compared with the Reference case. Zero-carbon technologies in AEO2023 include renewables, nuclear, and energy storage.
- The High Zero-Carbon Technology Cost case, which assumes no technology-cost declines for zero-carbon technologies, which maintain their 2022 costs through 2050.
- The Low Economic Growth case, which assumes the compound annual growth rate for U.S. GDP is 1.4%
- The High Economic Growth case, which assumes the compound annual growth rate for U.S. GDP is 2.3%
- The economic growth and zero-carbon technology cost combination cases, which simultaneously vary high and low economic growth with high and low zero-carbon technology costs.
In the Reference case, we project a large increase in renewable capacity of about 380% from 2022 through 2050. By comparison, fossil fuel generating capacity, which includes coal and natural gas-fired power plants, increases about 11%.
The economic growth and zero-carbon technology cost combination cases show the most extreme outcomes for growth of renewable and fossil fuel generating capacity out of all AEO2023 cases. The High Economic Growth and Low Zero-Carbon Technology Cost combination case has the highest projected growth in renewable capacity, increasing nearly 600% between 2022 and 2050.
Even in the Low Economic Growth and High Zero-Carbon Technology Cost combination case, which assumes the lowest growth in renewable technologies out of the AEO2023 cases, projected growth in renewable capacity approaches 230%.
The projected outcomes for both fossil fuel and renewable power plants are sensitive to the assumed cost of renewable technologies.
The projected outcomes for fossil fuel generating capacity also vary across AEO2023 cases. In the High Economic Growth and High Zero-Carbon Technology Cost combination case, fossil fuel capacity increases 36% between 2022 and 2050. In the Low Economic Growth and Low Zero-Carbon Technology Cost combination case, fossil fuel capacity decreases by 14% because more fossil fuel generators are retired than built over the projection period.
Principal contributor: Vikram Linga