
Global liquefied natural gas trade volumes set a new record in 2022
Note: GIIGNL has not released its 2022 report.
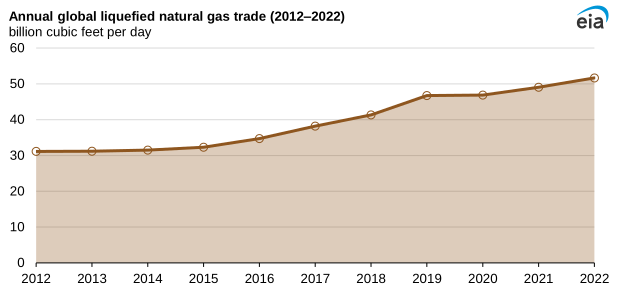
In 2022, global trade in liquefied natural gas (LNG) set a record high, averaging 51.7 billion cubic feet per day (Bcf/d), a 5% increase compared with 2021, according to data by CEDIGAZ. Liquefaction capacity additions, primarily in the United States, drove growth in global LNG trade. At the same time, increased LNG demand in Europe also contributed to trade growth as LNG continued to displace pipeline natural gas imports from Russia.
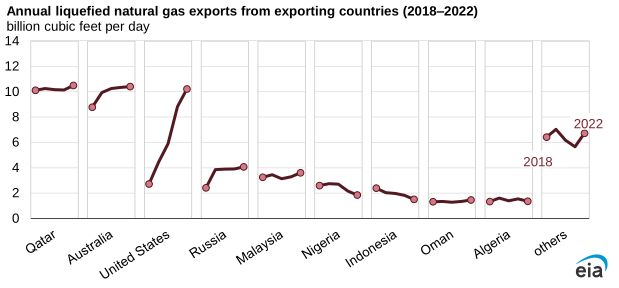
U.S. LNG exports in 2022 increased by 16% (1.4 Bcf/d) to 10.2 Bcf/d compared with 2021, the largest increase of all LNG-exporting countries. In the first half of 2022, after the new Calcasieu Pass LNG export facility was commissioned, the United States became the world’s top LNG exporter for the first time. However, because the Freeport LNG export terminal shut down, U.S. LNG exports declined in the second half of the year. In 2022, Qatar and Australia remained the top two global LNG exporters; Qatar’s exports averaged 10.5 Bcf/d, and Australia’s exports averaged 10.4 Bcf/d.
LNG exports increased by a combined 1.3 Bcf/d from Malaysia, Norway (after Hammerfest LNG returned to service in May), Trinidad and Tobago, Russia, Oman, and Equatorial Guinea. LNG exports from Algeria and Nigeria decreased by a combined 0.5 Bcf/d as both countries continued to experience issues with domestic natural gas production, which is used as a feedstock at LNG export facilities.
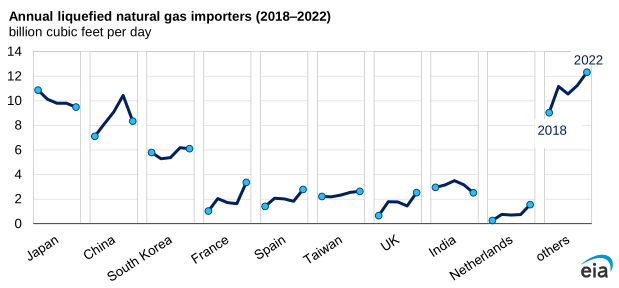
Among LNG-importing regions, Europe (including Türkiye) had the largest increase in LNG imports globally, increasing by 65% (6.5 Bcf/d) compared with 2021. LNG imports declined by 9% (3.2 Bcf/d) in Asia and by 34% (0.8 Bcf/d) in Latin America compared with 2021.
LNG imports into EU-27 countries and the UK increased substantially in 2022—by 73% (6.3 Bcf/d) compared with 2021—replacing imports by pipeline from Russia. Five countries—France, the UK, Spain, the Netherlands, and Belgium—increased LNG imports by a combined 5.4 Bcf/d, accounting for 85% of the total increase.
Japan was the top LNG importer for 50 years, until China surpassed Japan in 2021. The following year, in 2022, Japan resumed its position as top LNG importer. The decline in China was due, in part, to its zero-COVID policies, increased imports by pipeline from Russia, and higher use of coal. Other Asian countries, particularly those that rely more on global LNG spot markets, reduced spot purchases because of record-high LNG prices last year. LNG imports into India, Pakistan, and Bangladesh declined by a combined 18% (0.9 Bcf/d) in 2022 compared with 2021.
In Latin America, Brazil had the largest decrease in LNG imports—70% (0.6 Bcf/d)—mainly because the higher availability of electricity from hydropower generation reduced demand for natural gas-fired electricity generation in 2022 compared with 2021.
Principal contributors: Victoria Zaretskaya, Max Ober