
Crude oil prices increased in first-half 2022 and declined in second-half 2022
Note: Retail prices are in nominal terms and are not adjusted for inflation.
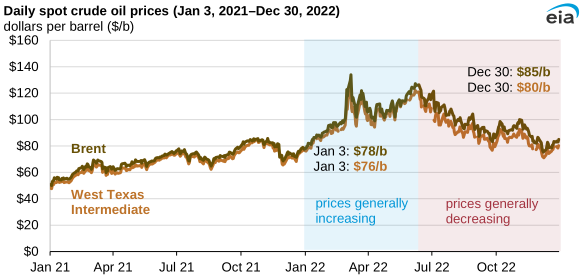
In the final trading day of 2022, the spot price of Brent crude oil, a global benchmark priced in Northwest Europe, closed at $85 per barrel (b), $7 higher than the price on January 3, 2022 ($78/b). The Brent price rose significantly in the first half of 2022 but generally declined in the second half of the year. The spot price for West Texas Intermediate (WTI), a benchmark price for U.S. crude oil, followed a similar pattern, finishing the 2022 trading year $4/b higher than on January 3. The Brent crude oil spot price averaged $100/b in 2022, and the WTI spot price averaged $95/b.
In the first half of 2022, geopolitical tension with Russia, culminating with Russia’s full-scale invasion of Ukraine on February 24, contributed to crude oil price increases. On March 8, 2022, the combination of Russia’s invasion of Ukraine with low global crude oil inventories lifted the 2022 crude oil price to the highest inflation-adjusted price since 2014.
The WTI price followed a similar path as the Brent crude oil price in 2022, averaging $5/b less than the Brent crude oil price, compared with $3/b less in 2021. The Brent-WTI crude oil spread (the difference between the two prices) increased in 2022 relative to 2021 because European countries needed to replace crude oil supplies they were importing from Russia with crude oil from another source. European markets were also affected by a strong U.S. dollar that made imported crude oil more expensive.
Crude oil prices increased in the first half of the year because of supply concerns. Russia’s full-scale invasion of Ukraine came during eight consecutive quarters (from the third quarter of 2020 to the second quarter of 2022) of global crude oil inventory decreases. The lower inventory was the result of withdrawals from storage to meet the demand that resulted from rising economic activity after pandemic-related restrictions eased.
From June 8 through the remainder of 2022, crude oil prices generally decreased as concerns about a possible economic recession reduced demand. High petroleum prices were one cause of persistent broad-based inflation in 2022 that affected consumer budgets and gasoline demand. High crude oil prices led to lower U.S. gasoline demand as gasoline prices rose. Meanwhile, severe COVID-19 containment measures in China contributed to lower global petroleum demand. On December 8, the price of Brent crude oil reached the lowest 2022 price, at $75/b.
Crude oil supply also increased in the second half of the year from U.S. and international Strategic Petroleum Reserve release programs, which increased the global supply of crude oil.
Principal contributor: Jimmy Troderman