
Average U.S. construction costs drop for solar, rise for wind and natural gas generators
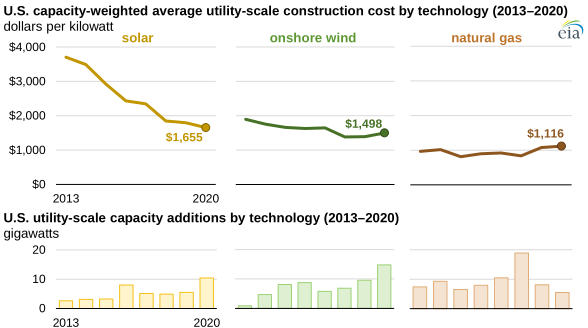
Construction costs for solar photovoltaic systems continued to decrease in the United States in 2020; the capacity-weighted average fell 8% compared with 2019, according to the latest data in our Annual Electric Generator Report on newly constructed utility-scale electric generators. By contrast, average construction costs for both wind turbines and natural gas-fired generators increased compared with 2019, by 8% for wind and 4% for natural gas.
These three technologies—solar, wind, and natural gas—accounted for over 95% of the capacity added to the U.S. electric grid in 2020. Investment in new electric generating capacity in 2020 increased by 40% compared with 2019 to $46.3 billion dollars.
Solar
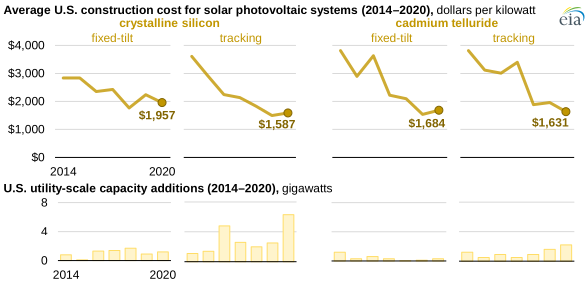
Average solar construction costs across all solar panel types fell 8% to $1,655 per kilowatt (kW) in 2020. The decrease was primarily driven by a 17% drop in the construction cost for cadmium telluride tracking panels, which fell to $1,631 per kW, their lowest capacity weighted average cost since 2014.
The average construction cost for crystalline silicon fixed-tilt panels fell by 13%, although they were still the most expensive of the major solar technologies, at $1,957 per kW.
The majority of solar panels installed in the United States are crystalline silicon tracking panels. Unlike fixed-tilt systems, solar tracking systems move to follow the sun as it moves across the sky, allowing for greater electricity production. A majority of tracking panels in the United States are single-axis tracking systems. In 2020, crystalline silicon tracking systems accounted for 61% of the utility-scale solar capacity added to the U.S. power grid. Construction costs for these systems increased by 6% in 2020, settling at $1,587 per kW.
Wind
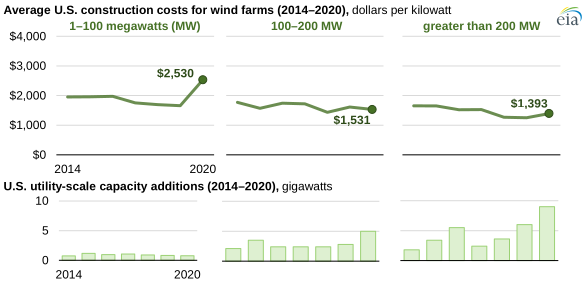
The average construction cost for onshore wind turbines rose 8% in 2020 from $1,391 per kW in 2019 to $1,498 per kW.
The two largest wind-farm size groups accounted for 95% of the wind capacity added to the U.S. power grid in 2020. The average construction cost for the largest wind farms—those with more than 200 megawatts (MW) of capacity—increased by 11% to $1,393 per kW. Wind farms ranging from 100 MW to 200 MW were the only group to decrease in average construction costs in 2020, from $1,615 per kW in 2019 to $1,531 per kW in 2020, down 5.2%.
Wind farms with 1 MW to 100 MW of capacity had an average construction cost increase of 53% to $2,530 per kW in 2020.
Natural gas
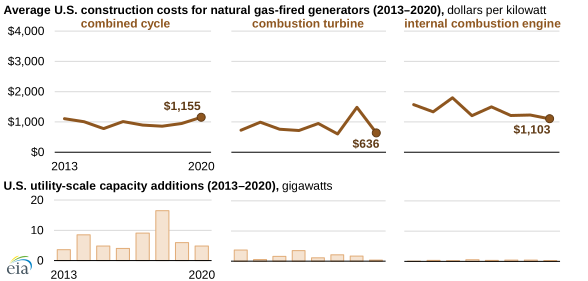
The average construction cost for natural gas-fired generating plants rose 4% from 2019 to 2020. The majority of natural gas electric-generating capacity installed in 2020 came from combined-cycle facilities. The average combined-cycle generator construction cost increased by 22% in 2020 to $1,155 per kW, up from $948 per kW in 2019.
Principal contributor: Alex Mey
Tags: solar, wind, natural gas, electricity, generation