
Mixed water supply conditions in the Northwest affect 2022 hydropower outlook
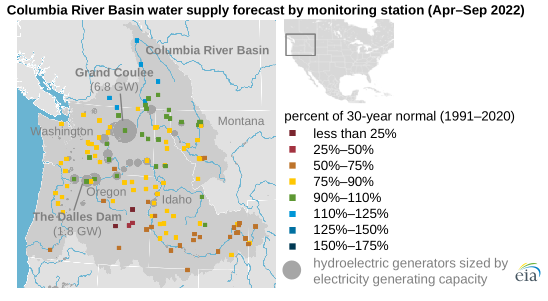
On February 3, the National Oceanic and Atmospheric Administration’s Northwest River Forecast Center (NWRFC) released its latest water supply forecast for the 2022 water year, which runs from October 2021 through September 2022. The NWRFC forecasts below-normal water supply in the southern areas of the Columbia River Basin and near-normal water supply in the rest of the basin. The region has improved from the drought conditions that have been limiting water supply in the western United States. NWRFC’s outlook contributes to our Short-Term Energy Outlook (STEO), which in February forecast 17% more electricity generation from hydropower in the Northwest in 2022 compared with 2021.
The Columbia River Basin contains more than one-third of U.S. hydropower capacity and generates enough electricity to power over 4 million homes. As such, changes in water supply in the Northwest can affect the use of other electricity-generating fuels in the region, such as natural gas, and can affect electricity trade with neighboring areas.
Seasonal precipitation and snowpack accumulation are the two main factors that help predict water supply. Seasonal precipitation influences soil moisture, and moister soil helps to preserve the snowpack, which in turn acts as a natural reservoir.
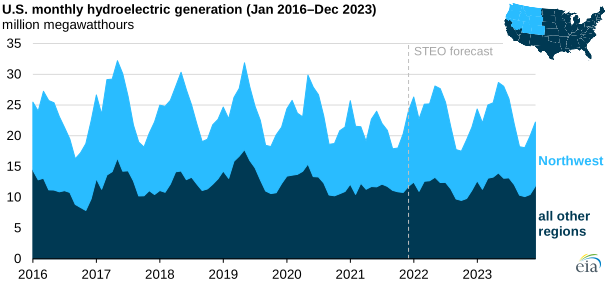
The 2022 water year, which began in October 2021, followed a historic drought that affected the western United States and included record-breaking heat waves, which caused drought emergencies across Washington, Oregon, and Idaho. Given the drought conditions last year, we estimate that hydropower generation decreased by 10% in the Northwest and by 9% in the entire United States compared with 2020.
More precipitation between October 2021 and January 2022 has led to near-normal snowpack accumulation across the northern part of the basin. However, snowpack accumulation in the southern part of the basin is still below normal because of less precipitation in the area. Significant precipitation and increased snowpack accumulation could still occur through April, which would change the water supply outlook and our hydroelectric generation forecast. April is normally when snowpack starts to melt, leading to spring runoff and peak hydropower generation in May and June.
In our February 2022 STEO, we forecast that U.S. hydropower plants will generate 278 million megawatthours of electricity in 2022, half of which will come from the Northwest. This amount of generation would be an 8% increase in U.S. hydroelectric generation from 2021. Overall, we expect hydroelectricity to account for 7% of total U.S. electricity generation in 2022.
Principal contributor: Lindsay Aramayo