
U.S. solar photovoltaic module shipments up 33% in 2020
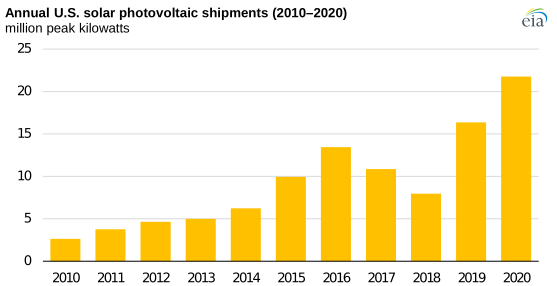
Despite the global COVID-19 pandemic, U.S shipments of solar photovoltaic (PV) modules (also referred to as solar panels) reached a record high of 21.8 million peak kilowatts (kW) in 2020, 5.4 million peak kW more than in 2019.
Solar PV module shipments include imports, exports, and modules produced and sold domestically. Demand for residential solar installations increased in 2020 in part because people were spending more time at home, which in turn resulted in an increased interest in home improvement. Other reasons for the increase in shipments include expiring solar tax credits, continued growth in utility-scale solar capacity, and falling costs for solar systems.
Solar PV module shipments generally track domestic PV capacity additions; differences between the two usually result from the lag time between shipment and installation. We categorize PV capacity additions as either utility-scale, which includes facilities with one megawatt (MW) of capacity or more, or small-scale, which are largely residential solar installations.
Solar PV capacity additions in the United States increased 25% from 2019 to 2020: utility-scale solar capacity increased 29%, and small-scale solar increased 19%.
The federal solar Investment Tax Credit (ITC) was set to decrease from 26% to 22% at the end of 2020. Some of the solar capacity growth in 2020 was a result of a rush to get projects installed before the expected ITC decrease. However, in December 2020, Congress passed an extension of the ITC, providing a 26% tax credit for solar systems installed from 2020 to 2022 and 22% for systems installed in 2023.
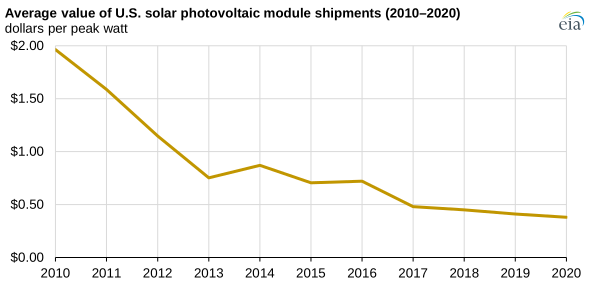
Although the supply chain for PV module components was disrupted a few times in 2020, the cost of PV modules has declined significantly since 2010, helping drive the growth of solar PV module shipments. The average value (a proxy for price) of solar shipments decreased from $1.96 per peak watt in 2010 to $0.38 per peak watt in 2020. Lower supply chain costs and an oversupply of modules because of increased production are largely responsible for the declines in the average value of solar PV modules over the past decade.
In 2020, 89% of U.S. solar PV module shipments were imports. PV module imports in 2020 totaled 19.3 million peak kilowatts (kW), an increase of 26% from the 15.3 million peak kW imported in 2019. Vietnam was the leading importer to the United States, followed by Malaysia, South Korea, and Thailand.
Principal contributor: Lolita Jamison
Tags: residential, exports/imports, solar, capacity