
Electricity demand in Lower 48 states reached a high of 720 gigawatthours on August 12
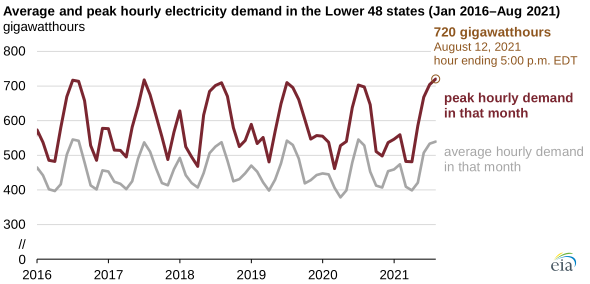
On August 12, 2021, most of the United States registered a daily high temperature above 90°F. Our Hourly Electric Grid Monitor shows that hourly electricity demand in the Lower 48 states reached 720 gigawatthours (GWh) for the hour ending 5:00 p.m. eastern daylight time (EDT) on that day, which is the highest reported value for a single hour since balancing authorities (BAs) began reporting hourly electricity demand to us in July 2015. The previous hourly high was 718 GWh reported for the hour ending 6:00 p.m. EDT on July 20, 2017.
On hot summer days, electricity demand typically peaks later in the day. Late afternoon and early evening hours are typically the warmest times of the day, which results in increased use of air conditioners, dehumidifiers, fans, and other cooling equipment.
Our Hourly Electric Grid Monitor is a centralized and comprehensive source for hourly operating data about the high-voltage bulk electric power grid in the Lower 48 states. It provides data on hourly electricity use for the 64 BAs that operate the electric grid in the Lower 48 states. The data used to calculate U.S. electricity demand are not collected from a single grid operator, but they are instead an aggregation of submissions from all reporting BAs. The information submitted is preliminary data, and we make it available as is.
Demand for electricity is one of the most important metrics BAs consider when managing their grid systems because grid operators must have enough electric generating capacity available to meet the highest level of electricity demand.
To meet peak demand, a sufficient number of electricity providers must be online and have access to transmission lines to be able to send electricity to where it’s needed. If either supply capability or transmission capacity are unavailable, grid operators may be required to curtail load on their respective systems.
Our Hourly Electric Grid Monitor provides hourly and daily operating data for much of the United States with a minimal reporting lag. However, because the data are published as is, we consider these data to be less definitive than the data gathered in our monthly and annual surveys. Information from those surveys are compiled in our Electric Power Monthly and Electric Power Annual, which contain electricity data for time periods before the Hourly Electric Grid Monitor's data collection began in July 2015.
According to those more definitive series, U.S. net electricity generation reached a monthly record high in August 2007 and an annual record high in 2018. According to forecasts in our latest Short-Term Energy Outlook, we do not expect the United States to exceed those monthly or annual records for net electricity generation at any point in 2021 or 2022.
Principal contributors: Mark Morey, Jonathan DeVilbiss
Tags: consumption/demand, electricity