
U.S. liquefied natural gas exports have declined by more than half so far in 2020
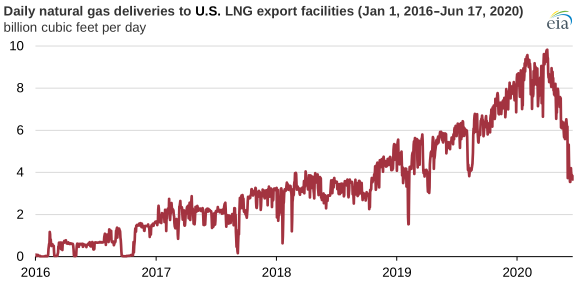
Daily natural gas deliveries to U.S. facilities that produce liquefied natural gas (LNG) for export were a record 9.8 billion cubic feet per day (Bcf/d) in late March 2020, but deliveries fell to less than 4.0 Bcf/d in June, according to data by IHS Markit. A mild winter and COVID-19 mitigation efforts have led to declining global natural gas demand and high natural gas storage inventories in Europe and Asia, reducing the need for LNG imports. Historically low natural gas and LNG spot prices in Europe and Asia have affected the economic viability of U.S. LNG exports. Trade press reports indicate that more than 70 cargoes were canceled for June and July deliveries, and more than 40 cargoes were canceled for August deliveries. In comparison, 74 cargoes were exported from the United States in January 2020.
In 2019, on an annual basis, the United States became the world’s third-largest LNG exporter; only Qatar and Australia exported more LNG. Several U.S. LNG export facilities became operational in 2019. Most recently, in May 2020, the third train at Freeport LNG in Texas began commercial operations. Later this summer, the third train at Cameron and three of Elba Island’s small-scale moveable modular liquefaction system units are expected to come online, bringing U.S. total liquefaction capacity to 8.9 Bcf/d of baseload LNG export capacity and 10.1 Bcf/d of peak export capacity.
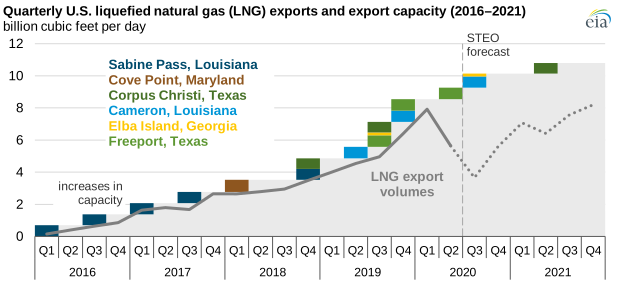
In January 2020, 74 LNG export cargoes were loaded in the United States, and LNG exports totaled 8.1 Bcf/d—both record highs. LNG exports were only slightly lower from February through April, but they started to decline in May. The U.S. Energy Information Administration (EIA) estimates that 62 cargoes were loaded in April and 52 cargoes were loaded in May. In its latest Short-Term Energy Outlook, EIA estimates that gross U.S. LNG exports in April and May totaled 7.0 Bcf/d and 5.8 Bcf/d, respectively. EIA forecasts that gross U.S. LNG exports will fall to a low of 3.2 Bcf/d in July 2020 before increasing in each of the remaining months of the year.
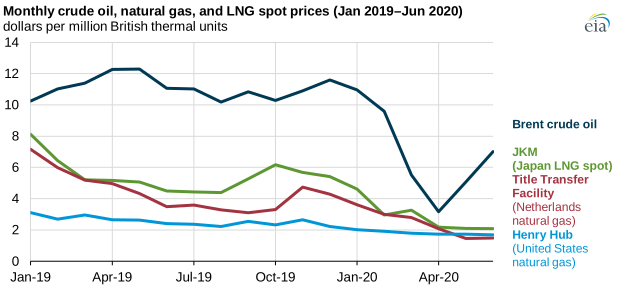
Global spot and forward LNG prices in Asia (such as the JKM price benchmark representing spot LNG prices in Japan, South Korea, Taiwan, and China) and natural gas prices in Europe (such as the TTF price benchmark in the Netherlands) have been at historical lows in recent months, which has affected the economic viability of U.S. LNG exports. U.S. LNG exports are priced at a premium to Henry Hub, in addition to tolling fees and transportation costs to destination markets. Higher spot and futures prices at Henry Hub compared with TTF prices in Europe since early May contributed to some cargo cancellations from the United States this summer. Based on the number of canceled cargoes, EIA expects U.S. LNG export capacity will be utilized at less than 50% during June, July, and August 2020.
Principal contributor: Victoria Zaretskaya