
Time between drilling and first production has little effect on oil well production
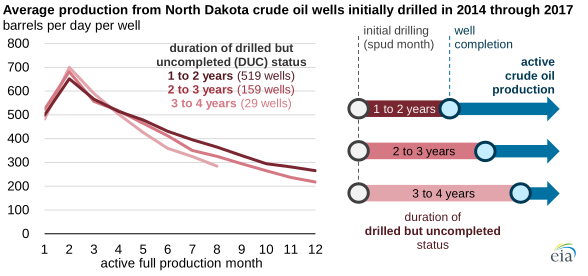
According to North Dakota production data, the length of time that an oil well has been drilled but remains uncompleted—meaning it has not yet started producing—has little effect on its initial production level. Oil wells are sometimes drilled but remain uncompleted for other operational or economic reasons. The North Dakota data provides insights into oil well completion practices.
The drilling and production process of an oil well starts with the initial drilling, or spudding. Once an oil well is drilled, the well must be completed before it can produce hydrocarbons. The completion process involves casing, cementing, perforating, hydraulic fracturing, and other procedures. Some oil wells are completed shortly after drilling is completed, but other wells remain drilled but uncompleted (DUC) for several months or years.
The crude oil drilling and completion processes involve different technologies, equipment, crews, and contracts.
- Drilling is accomplished through multiyear contracts between producers and drilling contractors. During the drilling process, oil wells are spudded and drilled in sequence with single or multiple rigs to maximize the number of wells drilled and minimize the idle transfer time between well locations.
- Completion is executed with short, batch-like contracts to complete a number of wells at the same time.
Wells do not have to be completed as soon as drilling is finished. To efficiently schedule well completions, producers maintain a reasonable number of DUCs for operational flexibility.
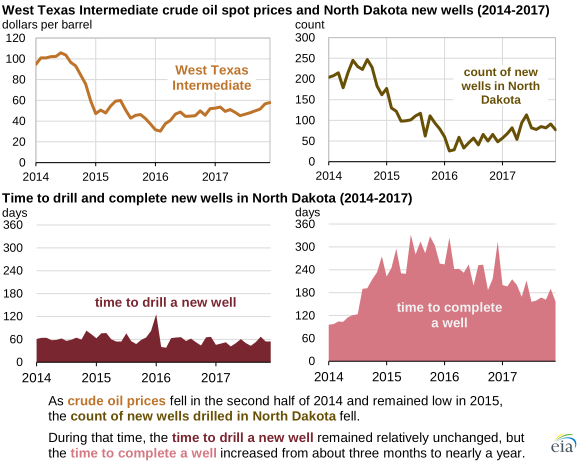
In a lower price environment, aggregate DUC counts increase because some producers postpone completion of their wells for economic reasons. From June 2014 to February 2016, U.S. crude oil benchmark prices declined from more than $107 per barrel (b) to less than $27/b. With lower crude oil prices, the number of newly completed wells in North Dakota decreased. Simultaneously, the number of DUC wells increased as the monthly average time to complete a well expanded from about three months to nearly one year. In spite of the lower prices, the average time to drill a new well remained less than two months.
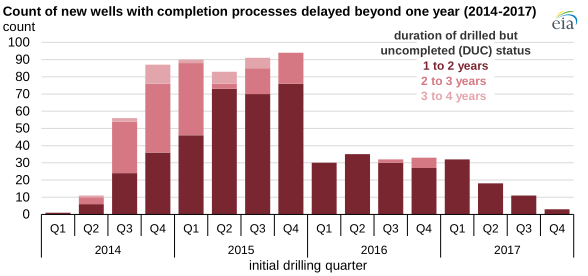
Between 2014 and 2017, delayed oil well completion in North Dakota created a high inventory of DUCs. From the backlog, 842 oil wells remained uncompleted for at least one year. In the time since crude oil prices started to recover in the second half of 2016, most of those wells (84%) were completed and began producing. Only 135 oil wells that were spudded during those three years still remain in DUC status awaiting completion, as of the end of June 2019. Only seven oil wells that were spudded between 2014 through 2017 have remained in DUC status for more than five years.
Ultimately, the amount of time that a well remains drilled but uncompleted has little effect on its initial production, according to analysis of well-level data from North Dakota Industrial Commission’s Oil and Gas Division. North Dakota is home to much of the prolific Bakken play that also spans parts of Montana. As production from the Bakken has increased, North Dakota has become the third-largest crude oil production area in the United States, behind Texas and the Gulf of Mexico.
Principal contributor: Jozef Lieskovsky, Richard Yan
Tags: production/supply, Bakken, drilling, North Dakota