
Bakken formation oil and gas drilling activity mirrors development in the Barnett
Bakken Shale Production (click image to animate)
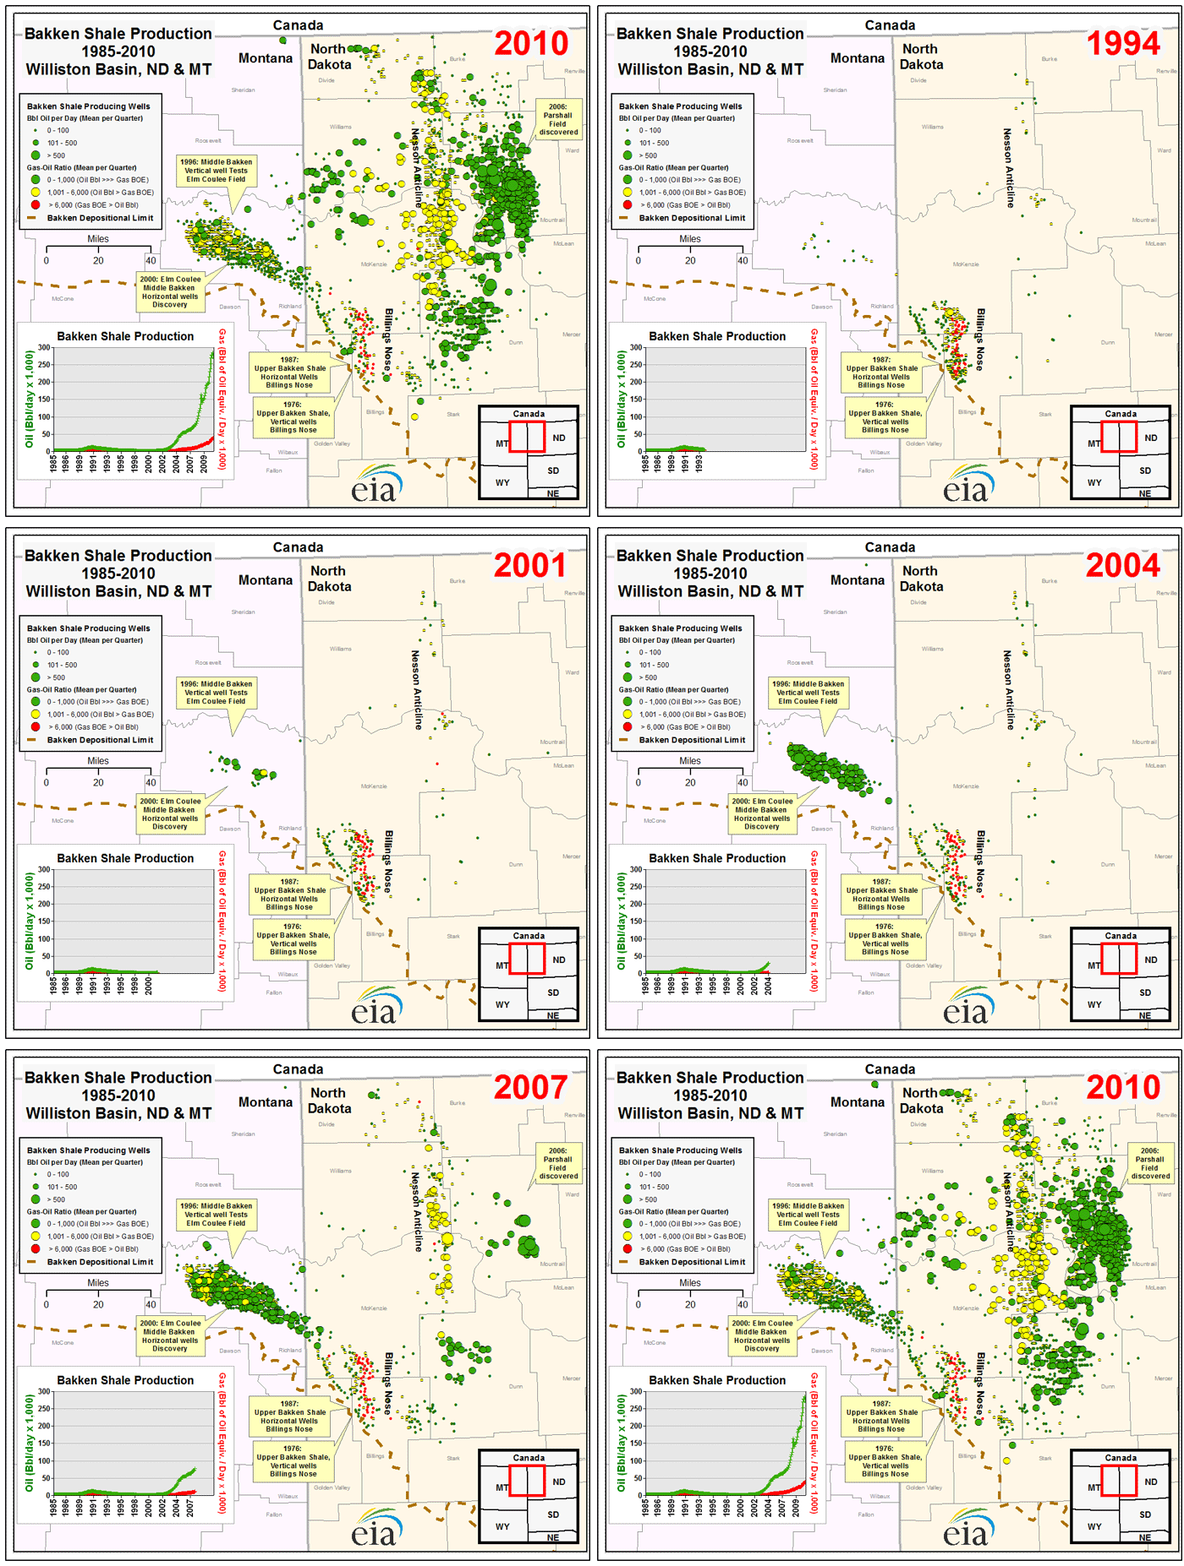
Note: Dot color is determined by the well's gas-oil production ratio, or the volume of natural gas produced relative to oil. The higher the ratio (from green to red), the more gas is being produced. Dot size represents the well's production volume: either gas measured in barrels of oil equivalent (BOE) or oil measured in barrels.
Oil production growth in the Bakken shale play mirrors somewhat the growth in natural gas production in the Barnett play. Like the Barnett, the Bakken drilling and production animation above shows that drilling activity built up gradually and eventually led to rapid growth, particularly from 2006 to 2010. Production grew because of increased use of horizontal drilling and the addition of hydraulic fracturing, coupled with elevated prices for crude oil and other natural gas liquids.
North Dakota is now the Nation's fourth largest oil-producing State—trailing only Texas, Alaska, and California—due mainly to Bakken production gains. According to the State's Department of Mineral Resources, total North Dakota oil production averaged 445 thousand barrels per day (bbl/d) in August 2011, up from an average of 344 thousand bbl/d at the end of 2010.
As the animated map above shows, the more productive Bakken oil wells were initially concentrated in Elm Coulee (see early increases in Montana wells), and then the Parshall area (see later increases in North Dakota wells) as drilling activity intensified to the east. The animation highlights that drilling activity in the Bakken has been focused mainly on crude oil and natural gas liquids (generally the green and yellow dots). The larger circles indicate higher productivity wells; these are mostly horizontal wells. Bakken production, which averaged just over 2 thousand bbl/d in 2000, averaged more than 260 thousand bbl/d in 2010; horizontal wells accounted for nearly 90% of total 2010 volumes.