
U.S. crude oil production growth projected to be led by light, sweet crude oil
Republished April 10, 2018, 11:15 a.m. to correct the units on the second graph.
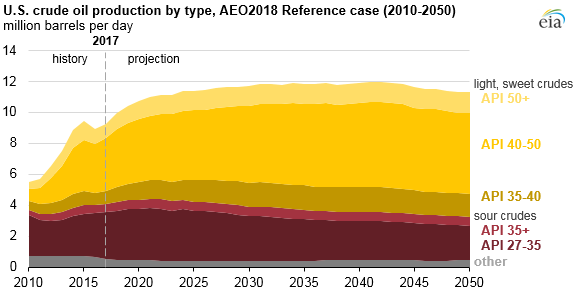
Recent growth in U.S. crude oil production has been primarily light, sweet crude oil, defined as having an API gravity of 35 or higher and sulfur content of 0.3% or less. These light, sweet crudes, which are produced from tight resource formations, accounted for up nearly 90% of the 3.1 million barrel per day (b/d) growth in production from 2010 to 2017. Light, sweet crude oil accounted for more than half (56%) of total domestic crude oil production in 2017, and in EIA’s Annual Energy Outlook 2018 (AEO2018) Reference case, this share grows to 60% by 2020 and to 70% by 2050.
U.S. supply of lighter crude oil from tight formations, such as the Bakken in North Dakota and the Wolfcamp and Eagle Ford in Texas, is projected in the Reference Case to continue to outpace that of medium and heavier crudes. Medium-gravity (API between 27 and 35) sour crudes, primarily Alaskan and Lower 48 states offshore production, accounted for about 30% of 2017 U.S. crude oil production and are projected to account for 18% of 2050 production in the AEO2018 Reference case.
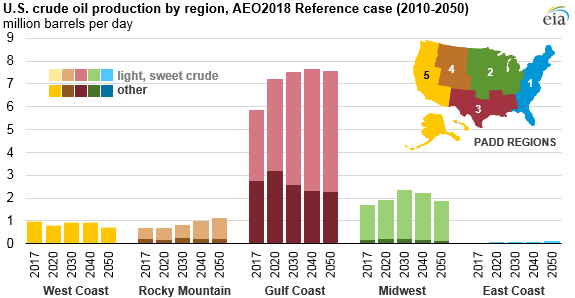
In the Reference Case, EIA projects that more than 80% of U.S. crude oil production from 2017 through 2050 will occur in the Gulf Coast and Midwest regions (as defined by Petroleum Administration for Defense Districts 3 and 2, respectively). Most of the growth in light, sweet crude oil production is projected in the Gulf Coast, increasing from 3.1 million b/d in 2017 to 5.3 million b/d in 2050.
The Permian Basin has developed into one of the more active drilling regions in the United States because of its large geographic size, spanning 53 million acres across western Texas and southeastern New Mexico, and favorable geology, with many prolific tight oil formations such as the Wolfcamp, Spraberry, and Bonespring. The Midwest region is home to the Bakken formation in North Dakota, another significant source of light, sweet crude oil production.
The pace and duration of projected crude oil production increases are dependent on crude oil prices and the quality and amount of technically recoverable resources. Two AEO2018 sensitivity cases explore this uncertainty.
In the High Oil and Gas Resource and Technology case, tight oil production is higher than in the Reference case, so light, sweet crudes account for a greater share of domestic crude oil production, eventually reaching 76% of the total in 2050. In the AEO2018 Low Oil and Gas Resource and Technology case, the growth in tight oil production is lower than in the Reference case, but light, sweet crudes still account for most (56%) of the domestic crude oil production in 2050.
Principal contributor: Dana Van Wagener