U.S. Energy Information Administration logo
Skip to sub-navigation
October 11, 2017

Winter heating costs likely to be higher this winter than last winter
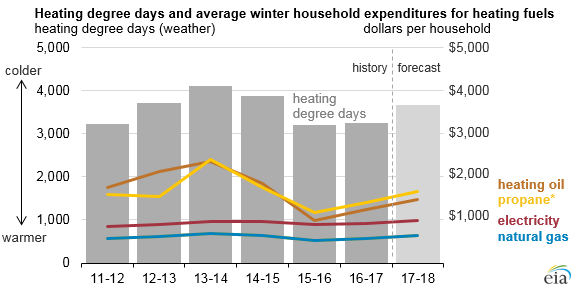
graph of heating degree days and average winter household expenditures for heating fuels, as explained in the article text
Source: U.S. Energy Information Administration, Short-Term Energy Outlook, Winter Fuels Outlook, October 2017
Note: Propane price is the weighted average of Midwest and Northeast prices. All other fuels reflect national averages.

Most U.S. households can expect higher heating expenditures this winter (October through March) than the last two winters according to EIA's Winter Fuels Outlook. Higher expected winter heating expenditures are the result of both more heating demand because of relatively colder weather and, to a lesser extent, higher fuel prices.

EIA’s projections of heating demand are based on the most recent temperature forecasts from the National Oceanic and Atmospheric Administration (NOAA). NOAA’s forecast anticipates that winter weather will be 13% colder than last winter and closer to the average of the previous 10 winters.

Because weather patterns present great uncertainty to winter energy forecasts, EIA's Winter Fuels Outlook includes projections for 10% colder and 10% warmer scenarios. In the past 10 winters, actual temperatures have been more than 10% colder than NOAA’s September forecast once and warmer than the forecast twice.
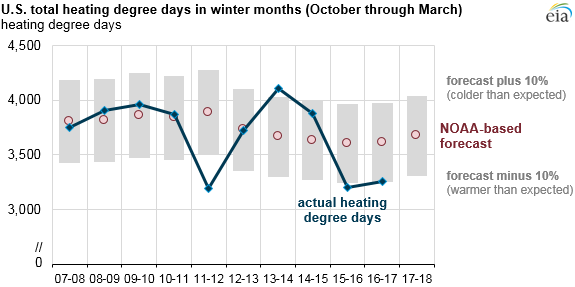
graph of U.S. total heating degree days in winter months, as explained in the article text
Source: U.S. Energy Information Administration, Short-Term Energy Outlook, Winter Fuels Outlook, October 2017

The average household winter heating fuel expenditures in EIA’s forecast provide a broad guide to expected heating expenditures. Fuel expenditures for any household also depend on the size and energy efficiency of the home and its heating equipment, indoor temperature preferences, and local weather conditions.

The choice of primary heating fuel varies considerably by region, resulting in regional differences in total expenditures. Natural gas is the most common space heating fuel in every region except the South, where electric heating is more prevalent. Heating oil is much more common in the Northeast than in other regions, while propane is more common in the Midwest.
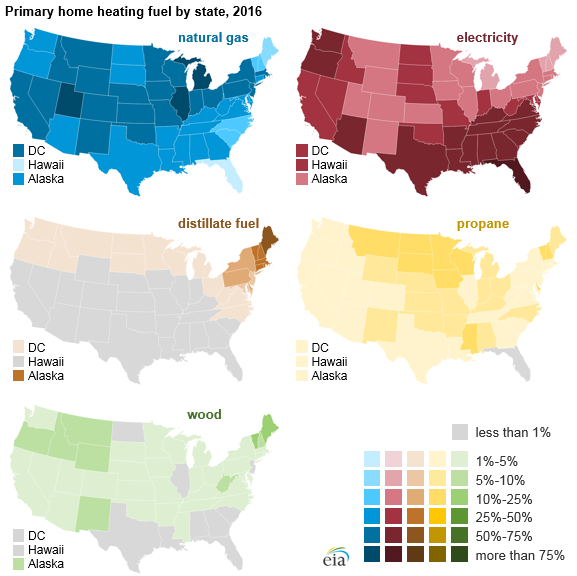
map of primary home heating fuel by state, as explained in the article text
Source: U.S. Energy Information Administration, based on Census Bureau American Community Survey 2016

More information about EIA’s expectations of winter fuels prices and expenditures is available in the Short-Term Energy Outlook supplement on winter fuels.
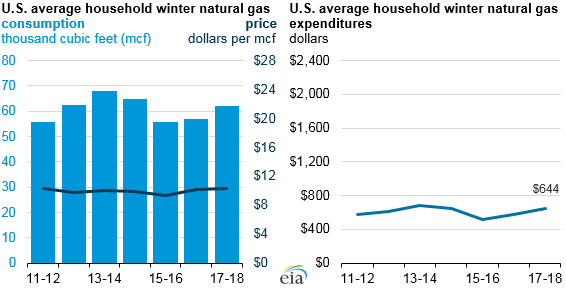
Graph of U.S. average household winter natural gas, as described in the article text

Source: U.S. Energy Information Administration, Short-Term Energy Outlook, Winter Fuels Outlook, October 2017
Note: Winter covers the period October 1 through March 31.
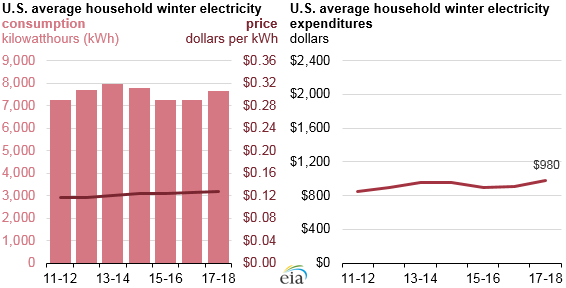
Graph of U.S. average household winter electricity, as described in the article text

Source: U.S. Energy Information Administration, Short-Term Energy Outlook, Winter Fuels Outlook, October 2017
Note: Winter covers the period October 1 through March 31.
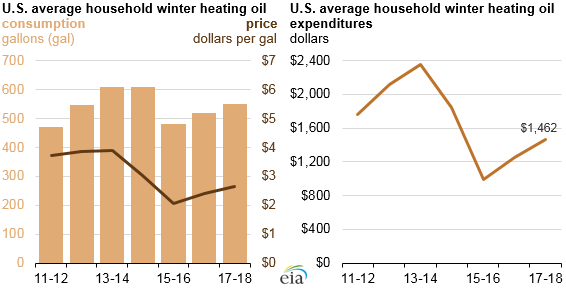
Graph of U.S. average household winter heating oil, as described in the article text

Source: U.S. Energy Information Administration, Short-Term Energy Outlook, Winter Fuels Outlook, October 2017
Note: Winter covers the period October 1 through March 31.
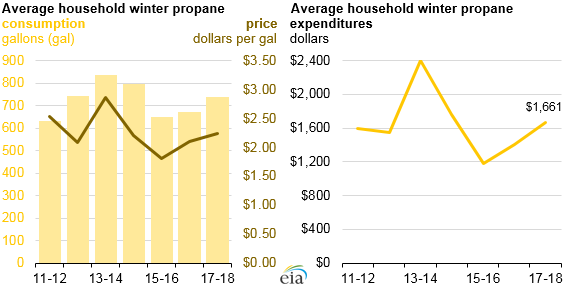
Graph of U.S. average household winter propane, as described in the article text

Source: U.S. Energy Information Administration, Short-Term Energy Outlook, Winter Fuels Outlook, October 2017
Note: Winter covers the period October 1 through March 31. Propane price is the weighted average of Midwest and Northeast prices.

Principal contributor: Stacy MacIntyre

Statistics
Analysis
Tools
Education
News

Petroleum & Other Liquids

Crude oil, gasoline, heating oil, diesel, propane, and other liquids including biofuels and natural gas liquids.

Natural Gas

Exploration and reserves, storage, imports and exports, production, prices, sales.

Electricity

Sales, revenue and prices, power plants, fuel use, stocks, generation, trade, demand & emissions.

Coal

Reserves, production, prices, employment and productivity, distribution, stocks, imports and exports.

Nuclear & Uranium

Uranium fuel, nuclear reactors, generation, spent fuel.

Renewable & Alternative Fuels

Includes hydropower, solar, wind, geothermal, biomass and ethanol.

EIA Survey Forms

Forms EIA uses to collect energy data including descriptions, links to survey instructions, and additional information.

Total Energy

Comprehensive data summaries, comparisons, analysis, and projections integrated across all energy sources.

U.S. States

State energy information, including overviews, rankings, data, and analyses.

International

International energy information, including overviews, rankings, data, and analyses.

Environment

Greenhouse gas data, voluntary reporting, electric power plant emissions.

Data Tools, Apps, & Maps

Tools to customize searches, view specific data sets, study detailed documentation, and access time-series data.

Open Data

EIA's free and open data available as API, Excel add-in, bulk files, and widgets

EIA Beta

Come test out some of the products still in development and let us know what you think!

Open Source Code

EIA's open source code, available on GitHub.

RSS Feeds

Subscribe to feeds for updates on EIA products including Today in Energy and What's New.