
Increasing exports contribute to large draw on propane inventories this winter
Note: Inventories include propane/propylene for fuel use only.
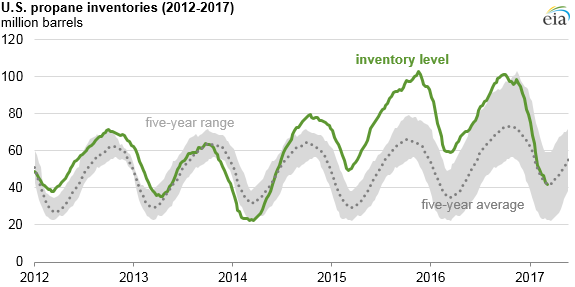
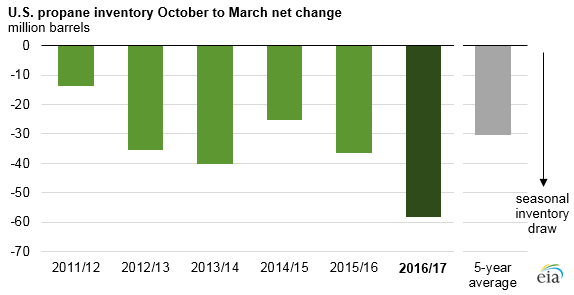
U.S. propane inventories, which had been above historical norms since mid-2014, declined by 59 million barrels from the beginning of October 2016 through early March 2017, the largest decline on record for this period, despite unseasonably mild temperatures. Inventories at the beginning of October were nearly 29 million barrels above the previous five-year average, but by March 3, fell to just slightly below the preceding five-year average for the first time since May 2014, based on data from EIA’s Weekly Petroleum Status Report. The strong inventory draws occurred despite weak heating demand this winter and mainly reflect rapid growth in propane exports.
Although propane has uses in the petrochemical and agricultural sectors, its dominant domestic use is as a heating fuel for homes and businesses during the winter. Because of the seasonal pattern in propane consumption, propane inventories typically peak between late September and mid-October and fall to their lowest levels in March. The inventory draw this winter, as of March 10, was nearly 23 million barrels larger than the draw last winter (2015–16) and 19 million barrels larger than during the winter of 2013–14, which featured several extremely cold weather events.
Note: Inventories include propane/propylene for fuel use only. 2016/2017 based on data through March 10, 2017.
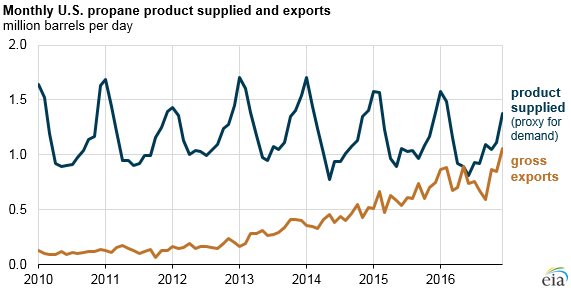
As domestic propane consumption has remained relatively flat or declined on an annual basis, U.S. exports of propane have continued to increase. Rising production and lower seasonal heating demand over the past two winters, in particular, have meant that more propane has been available for export. U.S. propane is exported to many different countries where it is used as a petrochemical feedstock, for transportation fuel, and for space heating. Similar to the United States, the use of propane as a heating fuel in other countries is seasonal, and the destination mix for U.S. exports of propane can be influenced by patterns of seasonal heating demand in different countries. However, most of the growth in U.S. propane exports serves growing demand from the expanding petrochemical sector in Asia.
Note: Inventories include propane/propylene for fuel use only.
Over the past four years, new and expanded export terminals and a growing shipping fleet increased the United States’ capacity to export propane. In November 2016, Phillips 66 opened a new Gulf Coast export terminal capable of sending out 150,000 barrels per day (b/d) of propane or butane. Gross U.S. monthly propane exports were 1.05 million b/d in December 2016, the first month that propane exports exceeded 1 million b/d.
Principal contributors: Stacy MacIntyre, Warren Wilczewski