
Marcellus Region production continues growth
Republished August 5, 2014, 10:35 a.m., text was edited to clarify content.
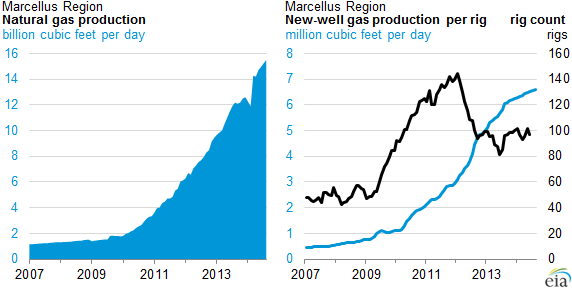
Natural gas production in the Marcellus Region exceeded 15 billion cubic feet per day (Bcf/d) through July, the first time ever recorded, according to EIA's latest Drilling Productivity Report. The Marcellus Region, mostly located in West Virginia and Pennsylvania, is the largest producing shale gas basin in the United States, accounting for almost 40% of U.S. shale gas production. Marcellus Region production has increased dramatically over the past four years, increasing from 2 Bcf/d in 2010 to its current level.
The rig count in the Marcellus Region has remained steady at around 100 rigs over the past 10 months. Given the continued improvement in drilling productivity, which EIA measures as new-well production per rig, EIA expects natural gas production in the Marcellus Region to continue to grow. With 100 rigs in operation and with each rig supporting more than 6 million cubic feet per day in new-well production each month, new Marcellus Region wells coming online in August are expected to deliver over 600 million cubic feet per day (MMcf/d) of additional production. This production from new wells is more than enough to offset the anticipated drop in production that results from existing well decline rates, increasing the production rate by 247 MMcf/d.
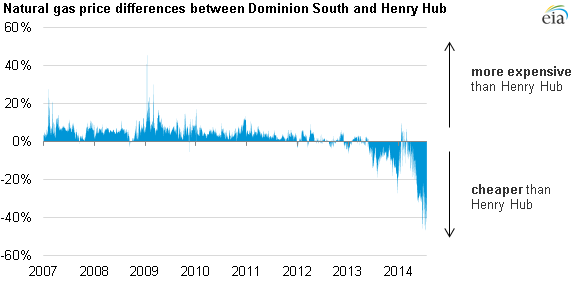
Note: Dominion South is located in southwest Pennsylvania.
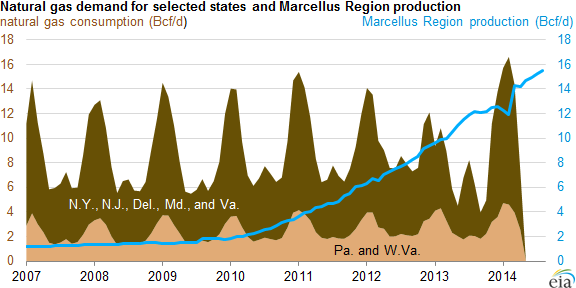
Increases in Marcellus Region production have wide-ranging effects, including contributing to record natural gas storage injections. Also, rising production in the Marcellus Region has outpaced growth in the region's pipeline capacity, which has resulted in multiple pipeline expansion projects focused on removing bottlenecks in the Marcellus Region. As pipeline capacity is increased, markets in the Northeast gain greater access to Marcellus Region gas, which can result in stabilized or decreased prices. Natural gas prices in the Northeast, such as the Dominion South trading point in southwestern Pennsylvania, have increasingly been below the Henry Hub price, in part because of increased access to Marcellus gas. Production in the Marcellus Region surpassed winter demand for natural gas in Pennsylvania and West Virginia several years ago and is now on track to be enough to equal the demand in those states plus New York, New Jersey, Delaware, Maryland, and Virginia combined.
Principal contributors: Jozef Lieskovsky, Richard Yan, Sam Gorgen