
Solar generation was 3% of U.S. electricity in 2020, but we project it will be 20% by 2050
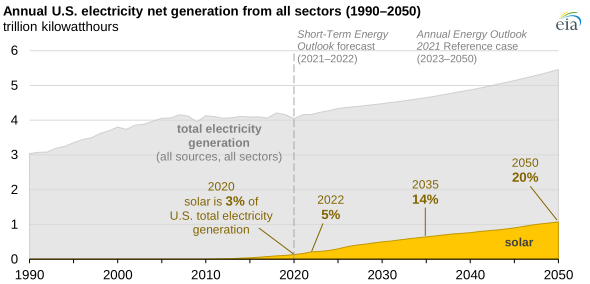
According to our Electric Power Annual, solar power accounted for 3% of U.S. electricity generation from all sources in 2020. In our Short-Term Energy Outlook, we forecast that solar will account for 4% of U.S. electricity generation in 2021 and 5% in 2022. In our Annual Energy Outlook 2021 (AEO2021) Reference case, which assumes no change in current laws and regulations, we project that solar generation will make up 14% of the U.S. total in 2035 and 20% in 2050. These data include electricity generated from both utility-scale (those of 1 megawatt or more generating capacity) and small-scale (less than 1 megawatt) solar facilities in the electric power, residential, commercial, and industrial sectors.
Humans have been using solar energy for centuries and first produced solar-powered electricity in the United States in 1954. Currently, solar energy can generate electricity in two ways: solar photovoltaics (PV) and solar thermal. Solar PV cells, such as rooftop solar panels, directly convert sunlight into electricity. Solar thermal facilities use mirrors to concentrate sunlight at a central receptor and produce the high temperatures needed to generate electricity with a steam-powered turbine.
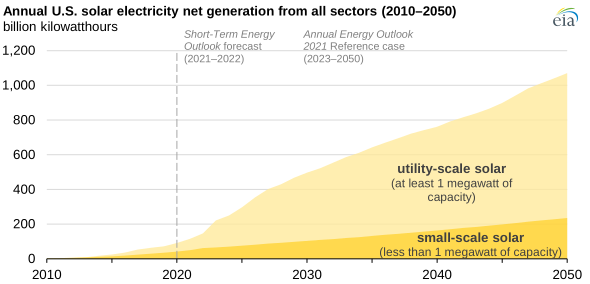
Increases in small-scale solar, particularly in the commercial and residential sectors, drove much of the early growth in U.S. solar electricity net generation. In 2011, small-scale solar accounted for 68% of total U.S. solar electricity net generation. However, utility-scale solar generation increased substantially in the United States during the past decade as average construction costs for solar power plants fell.
In our long-term projections, the electric power sector continues to produce the most solar generation, increasing from 68% of total solar generation in 2020 to 78% in 2050. The growing share of utility-scale generation is due in part to the availability of a 10% Investment Tax Credit (ITC) after 2023; in contrast, the ITC for small-scale solar has expired.
The AEO2021’s projected share of solar generation is affected by assumptions about the installed and operating costs of other generating technologies, particularly in later years of the projection period when the projected trends in solar are increasingly influenced by economic factors rather than policy. In a sensitivity case in which natural gas prices are higher than in the Reference case (the Low Oil and Gas Supply case), solar generation reaches 25% of total generation by 2050, compared with 20% in the Reference case. In another sensitivity case in which installed costs of renewables are lower than in the Reference case (the Low Renewables Costs case), solar generation makes up 27% of total generation by 2050.
Principal contributors: Mickey Francis, Manussawee Sukunta
Tags: generation, forecasts/projections, electricity, solar