
Haynesville natural gas production reached a record high in late 2021
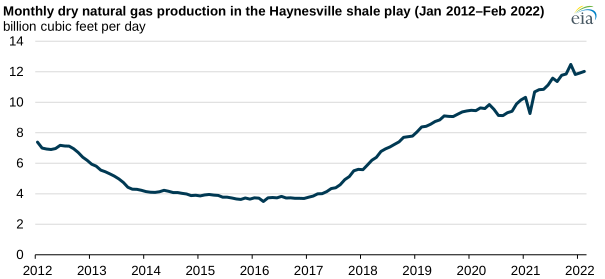
Dry natural gas production from the Haynesville shale play in northeastern Texas and northwestern Louisiana reached new highs in the second half of 2021, and production has remained relatively strong in early 2022. Haynesville natural gas production accounted for about 13% of all U.S. dry natural gas production in February 2022.
Haynesville is the third-largest shale gas-producing play in the United States. The Marcellus play in the Appalachian Basin (mainly in Pennsylvania, West Virginia, and Ohio) is the highest-producing shale gas play in the United States. During 2021, an average of 31.7 billion cubic feet per day (Bcf/d) of natural gas was produced from the Marcellus play. In the Permian play in Texas and New Mexico, production averaged 12.4 Bcf/d in 2021, making it the second-highest producing play. Altogether, the Marcellus, the Permian, and the Haynesville account for 52% of U.S. dry natural gas production.
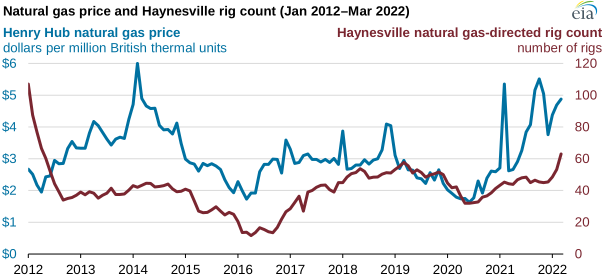
Natural gas production in the Haynesville declined steadily from mid-2012 until 2016 due to its relatively higher cost to produce natural gas compared with other producing areas. At depths of 10,500 feet to 13,500 feet, wells in the Haynesville are deeper than in other plays, and drilling costs tend to be higher. By comparison, wells in the Marcellus in the Appalachian Basin are shallower—between 4,000 feet and 8,500 feet. Years of relatively low natural gas prices meant it was less economical to drill deeper wells. However, because natural gas prices have increased since mid-2020, producers have an incentive to increase the number of rigs in operation and use those rigs to drill deeper wells.
Producers tend to increase or decrease the number of drilling rigs in operation as natural gas prices fluctuate. The number of natural gas-directed rigs in the Haynesville has been rising steadily since the second half of 2020 and reached an average of 46 rigs in 2021, according to data from Baker Hughes. Since the beginning of 2022, producers have added 17 rigs in the Haynesville region. For the week ending April 8, there were 64 natural gas-directed rigs operating in the Haynesville, representing 45% of natural gas-directed rigs currently operating in the United States.
Pipeline takeaway capacity out of the Haynesville has also increased in recent years. The additional capacity allows producers to reach industrial demand centers and liquefied natural gas terminals on the U.S. Gulf Coast. The Enterprise Products Partners’ Gillis Lateral pipeline and the associated expansion of the Acadian Haynesville Extension entered into service in December 2021. Prior to that project, Enbridge Midcoast Energy’s CJ Express pipeline entered into service in April 2021. These projects added 1.3 Bcf/d of takeaway capacity in the Haynesville area, which is currently estimated to total 15.9 Bcf/d according to PointLogic.
Principal contributor: Katy Fleury
Tags: production/supply, natural gas, shale, Haynesville