
EIA launches redesigned Hourly Electric Grid Monitor with new data and functionality
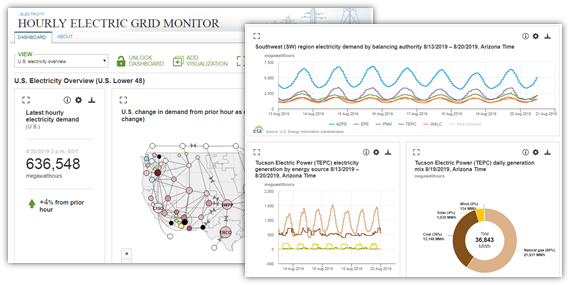
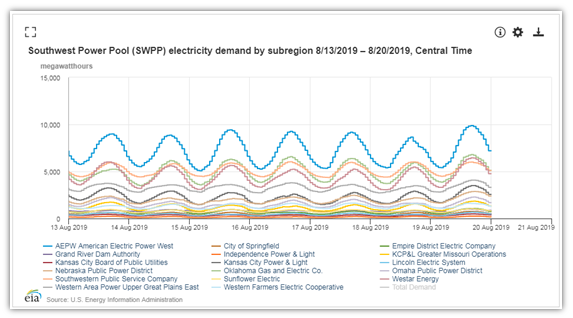
Today, the U.S. Energy Information Administration (EIA) launches a beta release of its new Hourly Electric Grid Monitor, a redesigned and enhanced version of EIA’s existing U.S. Electric System Operating Data website. The Hourly Electric Grid Monitor incorporates two new data elements: hourly electricity generation by energy source and hourly subregional demand for certain balancing authorities in the Lower 48 states. The new website also provides new and more flexible options for visualizing the data and allows users to create custom dashboards that can be saved and shared.
The new website includes two sets of default dashboard views:
- Electricity overview: U.S., regional, and balancing authority electricity overviews display the latest eight days of hourly demand, forecast demand, subregional demand (where available), generation by energy source, and interchange data. Each balancing authority’s total demand data are available on a near real-time basis, about one hour after the hour has ended. Most of the other data elements are available on a one- to two-day lag.
- Daily generation mix: These views display aggregated daily snapshots of electricity generation by energy source for the latest available full day for the United States and its regions or for a region and the balancing authorities in that region. The generation data displayed generally do not include distributed generation resources, such as rooftop solar, or other generation resources that balancing authorities do not directly manage or monitor.
Users can also build, save, and share their own custom dashboards. Charts have various options for customizing the visualization type, data frequency, and fixed or dynamic date ranges. Custom dashboards allow users to set up their own views to track electricity activity during special situations such as hurricanes, heat waves, or cold weather events.
New map animations highlight the dynamic nature of electricity demand across the country during the course of a day. The animated graphic below shows U.S. electricity demand for two extreme weather days in 2019—January 30, the peak day of this past winter’s polar vortex, and July 19, the peak day of a recent summer heat wave.
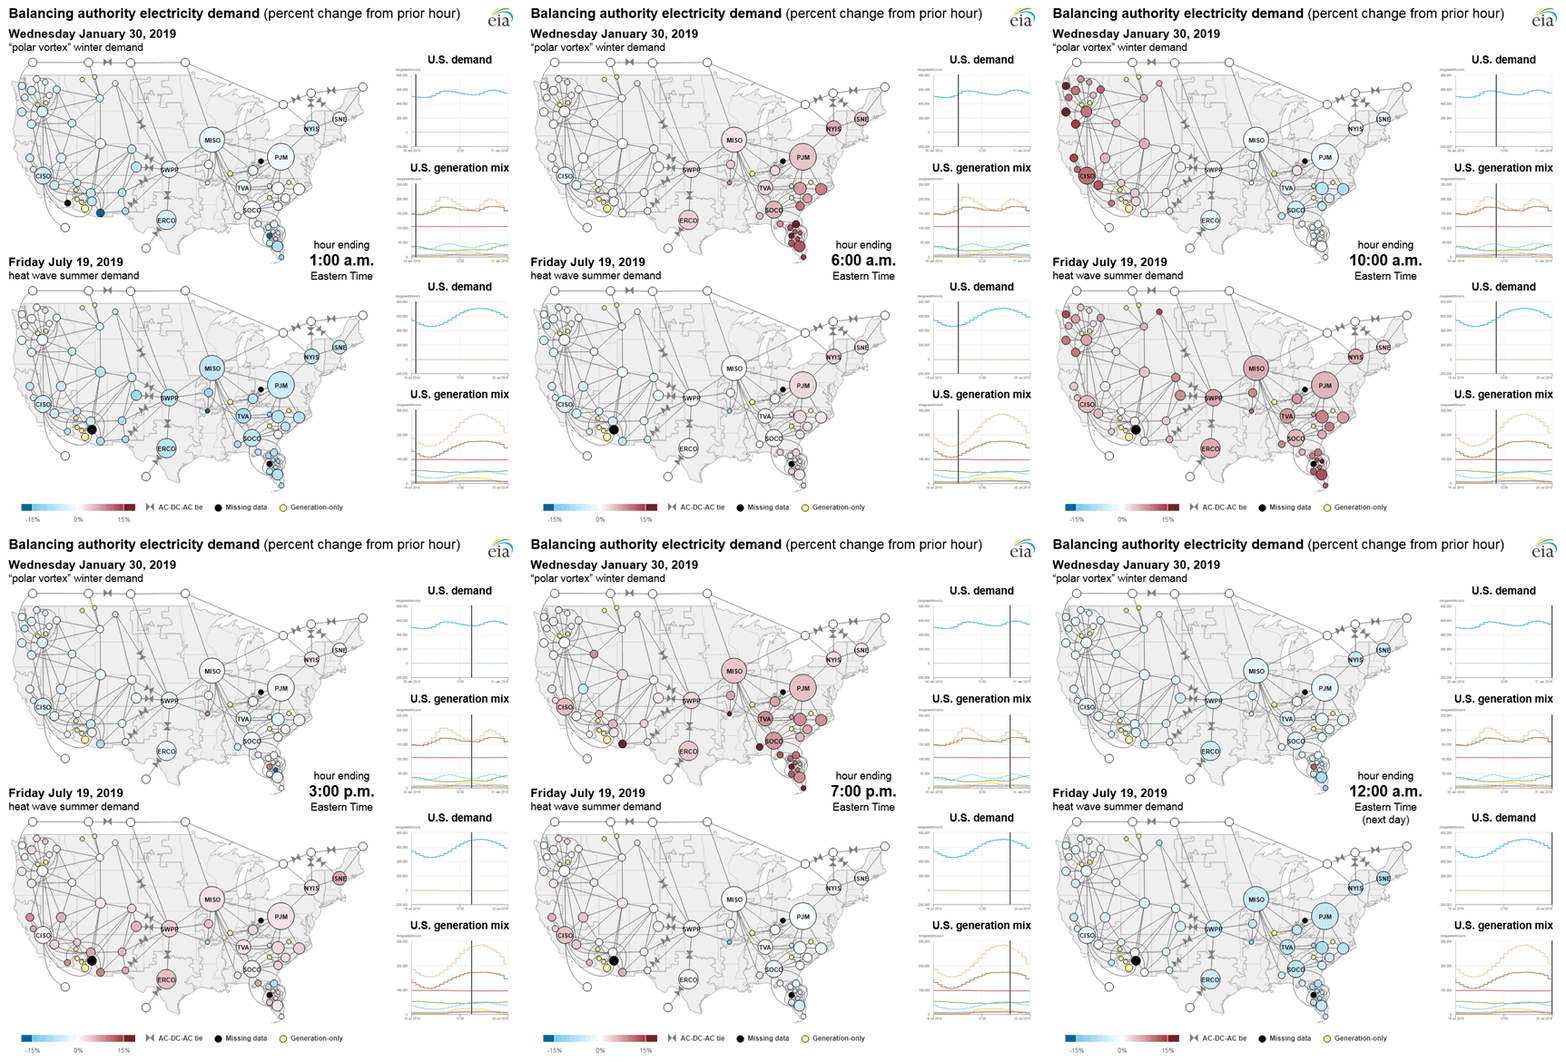
Note: See a larger version. For more information, visit the interactive data dashboard.
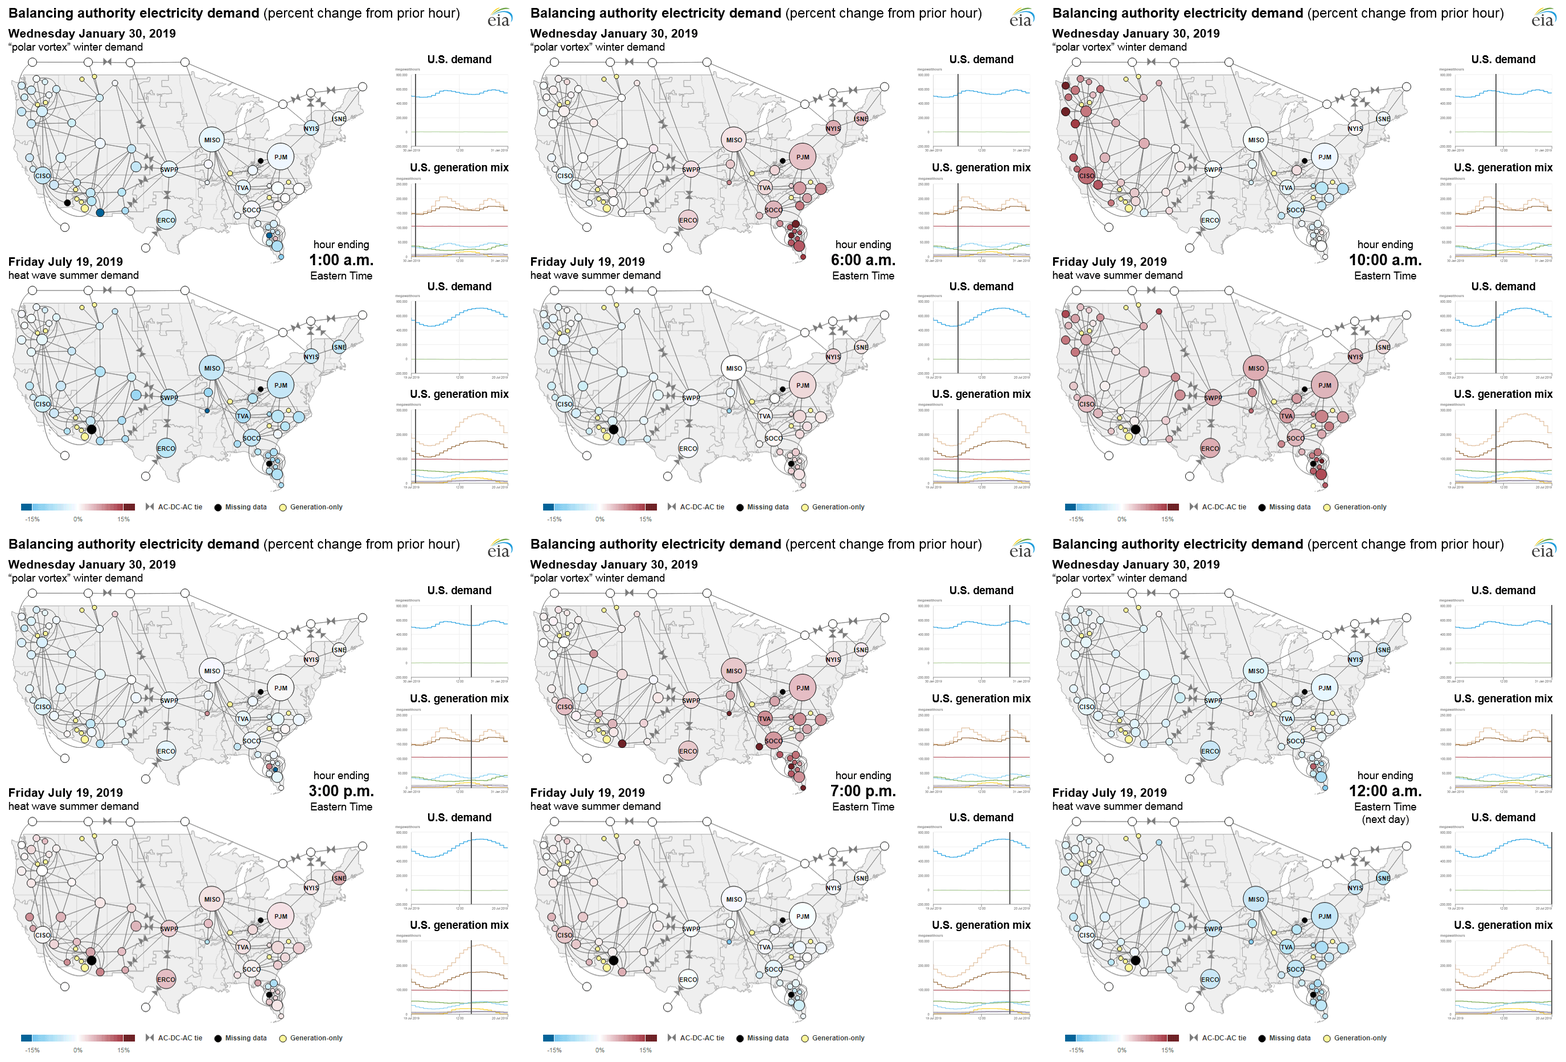
Although January 30 and July 19, 2019, were extreme weather days, they illustrate typical winter and summer electricity demand patterns. The animation also highlights how hourly changes in electricity demand often roll across the country from east to west because of the time differences. Demand patterns vary further by balancing authority and region because of many factors, including differences in regional climates and structural differences in electricity usage. For example, some regions use electricity more than natural gas for space heating, and some regions have relatively few homes with air conditioning. All of these regional and seasonal differences in electricity demand affect how the grid is operated and how electricity generation resources are used.
EIA collects the data for the Hourly Electric Grid Monitor from its Form EIA-930, Hourly and Daily Balancing Authority Operations Report, which includes hourly electricity demand, forecast demand, net generation, and interchange data. The data are provided by the 65 electricity balancing authorities that operate the electric grid in the Lower 48 states and maintain real-time balance between electricity demand and supply on the grid.
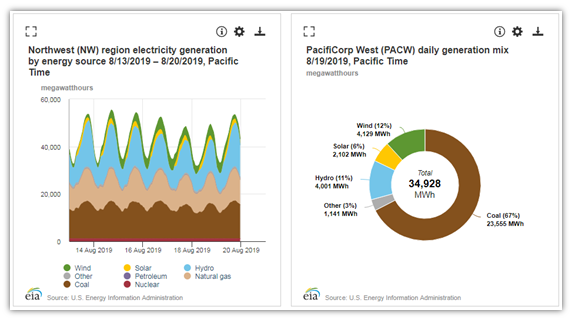
Beginning in July 2018, EIA began collecting net generation by energy source (from all balancing authorities) and demand by subregion (from balancing authorities that regularly compile this data). Historical data are available through the website going back to July 2018 for the new data elements and July 2015 for the original data elements.
Currently, eight balancing authorities report subregional demand data:
- California Independent System Operator (CISO)
- Electric Reliability Council of Texas, Inc. (ERCO)
- Midcontinent Independent System Operator, Inc. (MISO)
- New England ISO (ISNE)
- New York Independent System Operator (NYIS)
- PJM Interconnection, LLC (PJM)
- Public Service Company of New Mexico (PNM)
- Southwest Power Pool (SWPP)
EIA has also expanded download and export options in the new tool. Users can download data in CSV, JSON, and XLSX formats as well as through EIA’s application programming interface (API) and Excel Add-In. Static versions of the charts and maps are available to download as PDF or PNG image files.
EIA welcomes feedback about the new Hourly Electric Grid Monitor. Users can submit comments through the contact form at the top of each page on the website. EIA’s existing U.S. Electric System Operating Data website will remain available during the beta release.
Principal contributors: April Lee, Jonathan DeVilbiss