Today in Energy
Recent Today in Energy analysis of natural gas markets is available on the EIA website.
Market Highlights:
(For the week ending Wednesday, January 21, 2026)Prices
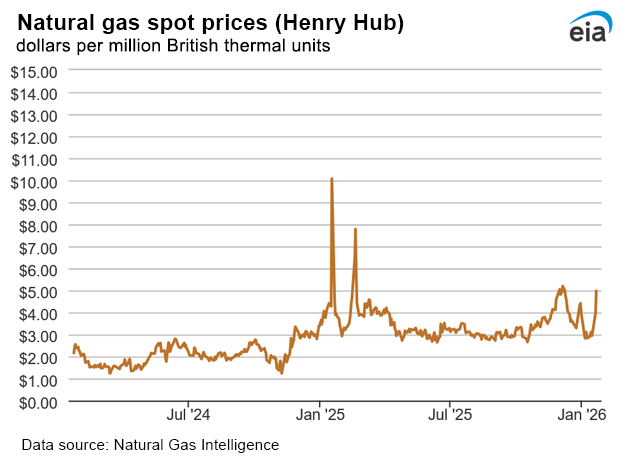
- Henry Hub spot price: The Henry Hub spot price rose $1.86 per million British thermal units (MMBtu) from $3.12/MMBtu last Wednesday to $4.98/MMBtu yesterday.
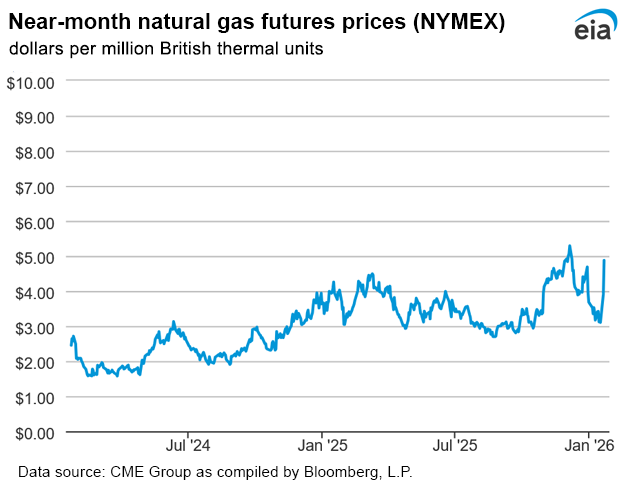
- Henry Hub futures price: The price of the February 2026 NYMEX contract increased $1.76, from $3.120/MMBtu last Wednesday to $4.875/MMBtu yesterday. The price of the 12-month strip averaging February 2026 through January 2027 futures contracts climbed 65 cents to $3.970/MMBtu. The increase in futures prices is mostly a reaction to anticipated changes in 2026 storage balances and so far has not had a material influence on prices in the longer-dated part of the curve.
- Select regional spot prices: Natural gas spot prices rose at most locations this report week (Wednesday, January 14, to Wednesday, January 21). Price changes ranged from a decrease of $1.49/MMBtu at Transco Zone 6 NY to an increase of $2.08/MMBtu at the Houston Ship Channel. In trades executed on Wednesday, a majority of U.S. natural gas hubs reported prices over $4.00/MMBtu.
- Prices in the broader South rose this report week due to cooling regional temperatures. The price at Florida Gas Zone 3, a key receipt point for purchases of natural gas consumed in Florida, rose $1.42 from $3.61/MMBtu last Wednesday to $5.03/MMBtu yesterday. Average temperatures in the Tallahassee Area fell 14°F this week to 43°F, leading to 151 heating degree days (HDD), 88 HDDs more than last week, and 60 HDDs above normal. The price at the Houston Ship Channel rose $2.08 from $2.47/MMBtu last Wednesday to $4.55/MMBtu yesterday. Temperatures in the Houston Area averaged 53°F this week, down 6°F from the previous week, which led to 86 HDDs, 29 HDDs more than last week and 2 HDDs above normal. Total natural gas consumption in the Southeast rose 26% (3.5 billion cubic feet per day [Bcf/d]), led by a 54% (2.0 Bcf/d) increase in residential and commercial sector consumption, according to LSEG Data. Consumption in the electric power sector in the Southeast increased 17% (1.3 Bcf/d) this week as power consumption for space heating demand increased.
- International futures prices: International natural gas futures prices increased this report week. According to Bloomberg Finance, L.P., weekly average front-month futures prices for liquefied natural gas (LNG) cargoes in East Asia increased $1.14/MMBtu to a weekly average of $10.73/MMBtu. Natural gas futures for delivery at the Title Transfer Facility (TTF) in the Netherlands increased $2.18/MMBtu to a weekly average of $12.40/MMBtu. In the same week last year (week ending January 22, 2025), the prices were $14.01/MMBtu in East Asia and $14.57/MMBtu at TTF. Reduced European Union storage, down to 48% on January 20 compared with the five-year average of 63%, is a key driver of rising prices at TTF according to Gas Storage Europe’s Aggregated Gas Storage Inventory (AGSI+). Top
Daily spot prices by region are available on the EIA website.
Liquefied Natural Gas (LNG)
- Vessels departing U.S. ports: Thirty-seven LNG vessels with a combined LNG-carrying capacity of 139 billion cubic feet (Bcf) departed U.S. ports between January 15 and January 21, according to shipping data provided by Bloomberg Finance, L.P.:
- Nine tankers from Sabine Pass
- Eight from Plaquemines
- Six from Corpus Christi
- Four each from Cameron and Calcasieu Pass
- Three each from Cove Point and Freeport
Rig Count
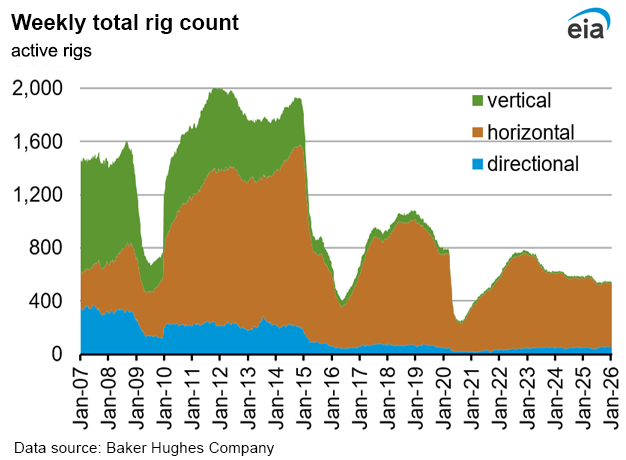
- According to Baker Hughes, for the week ending Tuesday, January 13, the natural gas rig count decreased by 2 rigs from a week ago to 122 rigs. The Eagle Ford dropped one rig, and two rigs were dropped among unidentified producing regions. The Haynesville added one rig. The number of oil-directed rigs increased by 1 rig from a week ago to 410 rigs. The Eagle Ford added one rig. The total rig count, which includes 11 miscellaneous rigs, now stands at 543 rigs, 37 fewer than at this time last year.
Storage
- Net withdrawals from storage totaled 120 Bcf for the week ending January 16, compared with the five-year (2021–25) average net withdrawals of 191 Bcf and last year's net withdrawals of 228 Bcf during the same week. Working natural gas stocks totaled 3,065 Bcf, which is 177 Bcf (6%) more than the five-year average and 141 Bcf (5%) more than last year at this time.
- The average rate of withdrawals from storage is 2% lower than the five-year average so far in the withdrawal season (November through March). If the rate of withdrawals from storage matched the five-year average of 14.5 Bcf/d for the remainder of the withdrawal season, the total inventory would be 1,995 Bcf on March 31, which is 177 Bcf higher than the five-year average of 1,818 Bcf for that time of year.
See also:
Top
| Spot Prices ($/MMBtu) | Thu, 15-Jan |
Fri, 16-Jan |
Mon, 19-Jan |
Tue, 20-Jan |
Wed, 21-Jan |
|---|---|---|---|---|---|
| Henry Hub | 2.95 | 3.13 | Holiday | 3.98 | 4.98 |
| New York | 4.79 | 12.92 | Holiday | 3.65 | 5.52 |
| Chicago | 2.70 | 3.02 | Holiday | 3.56 | 4.79 |
| Cal. Comp. Avg.* | 1.83 | 1.84 | Holiday | 2.33 | 2.84 |
| *Avg. of NGI's reported prices for: Malin, PG&E Citygate, and Southern California Border Avg. | |||||
| Source: NGI's Daily Gas Price Index | |||||
| Rigs | |||
|---|---|---|---|
Tue, January 13, 2026 |
Change from |
||
|
last week
|
last year
|
||
| Oil rigs |
410
|
0.2%
|
-14.2%
|
| Natural gas rigs |
122
|
-1.6%
|
24.5%
|
| Note: Excludes any miscellaneous rigs | |||
| Rig numbers by type | |||
|---|---|---|---|
Tue, January 13, 2026 |
Change from |
||
|
last week
|
last year
|
||
| Vertical |
12
|
0.0%
|
-7.7%
|
| Horizontal |
475
|
0.0%
|
-7.8%
|
| Directional |
56
|
-1.8%
|
7.7%
|
| Data source: Baker Hughes Company |
|||
| Working gas in underground storage | ||||
|---|---|---|---|---|
Stocks billion cubic feet (Bcf) |
||||
| Region |
2026-01-16 |
2026-01-09 |
change |
|
| East |
632 |
664 |
-32 |
|
| Midwest |
752 |
790 |
-38 |
|
| Mountain |
242 |
251 |
-9 |
|
| Pacific |
300 |
302 |
-2 |
|
| South Central |
1,139 |
1,178 |
-39 |
|
| Total |
3,065 |
3,185 |
-120 |
|
|
Data source: U.S. Energy Information Administration Form EIA-912, Weekly Underground Natural Gas Storage Report Note: Totals may not equal sum of components because of independent rounding. | ||||
| Working gas in underground storage | |||||
|---|---|---|---|---|---|
Historical comparisons |
|||||
Year ago 1/16/25 |
5-year average 2021-2025 |
||||
| Region | Stocks (Bcf) |
% change |
Stocks (Bcf) |
% change |
|
| East |
621 |
1.8 |
655 |
-3.5 |
|
| Midwest |
753 |
-0.1 |
784 |
-4.1 |
|
| Mountain |
231 |
4.8 |
180 |
34.4 |
|
| Pacific |
271 |
10.7 |
228 |
31.6 |
|
| South Central | 1,048 |
8.7 |
1,041 |
9.4 |
|
| Total | 2,924 |
4.8 |
2,888 |
6.1 |
|
| Data source: U.S. Energy Information Administration Form EIA-912, Weekly Underground Natural Gas Storage Report
Note: Totals may not equal sum of components because of independent rounding. |
|||||
| Temperature – heating & cooling degree days (week ending Jan 15) | ||||||||
|---|---|---|---|---|---|---|---|---|
HDDs |
CDDs |
|||||||
| Region | Current total |
Deviation from normal |
Deviation from last year |
Current total |
Deviation from normal |
Deviation from last year |
||
| New England | 199 |
-75 |
-69 |
0 |
0 |
0 |
||
| Middle Atlantic | 197 |
-65 |
-71 |
0 |
0 |
0 |
||
| E N Central | 225 |
-72 |
-96 |
0 |
0 |
0 |
||
| W N Central | 234 |
-85 |
-93 |
0 |
0 |
0 |
||
| South Atlantic | 144 |
-40 |
-84 |
7 |
-1 |
7 |
||
| E S Central | 154 |
-37 |
-82 |
0 |
-2 |
0 |
||
| W S Central | 107 |
-34 |
-70 |
3 |
0 |
3 |
||
| Mountain | 200 |
-36 |
-57 |
0 |
0 |
0 |
||
| Pacific | 88 |
-35 |
-25 |
0 |
0 |
0 |
||
| United States | 172 |
-54 |
-72 |
2 |
0 |
2 |
||
|
Data source: National Oceanic and Atmospheric Administration Note: HDDs=heating degree days; CDDs=cooling degree days | ||||||||
Average temperature (°F)
7-day mean ending Jan 15, 2026
Data source: National Oceanic and Atmospheric Administration
Deviation between average and normal temperature (°F)
7-day mean ending Jan 15, 2026
Data source: National Oceanic and Atmospheric Administration
Monthly U.S. dry shale natural gas production by formation is available in the
Short-Term Energy Outlook.