Summary
In the face of unprecedented levels of domestic natural gas production, net imports of natural gas into the United States fell 23 percent in 2012. Net imports as a percentage of total natural gas consumed decreased to around 6 percent from 8 percent in 2011. A combination of both higher exports and lower imports led to a decline in net imports in 2012. Based on preliminary data for 2012, domestic dry natural gas production increased by about 5 percent to 24,063 billion cubic feet (Bcf). This growth led to greater domestic natural gas supply and relatively low prices in the United States, thus reducing U.S. reliance on foreign natural gas. It also widened the price differential between Henry Hub and foreign markets outside of North America, increasing interest in the potential export of liquefied natural gas (LNG). As of May 17, 2013, 26 applications have been filed with the Department of Energy (DOE) for authorization to export domestic LNG to foreign countries. The Sabine Pass Liquefaction LLC and the Freeport LNG Expansion LP and FLNG Liquefaction LLC are the only two companies that have received DOE's approval to export domestic LNG to both Free Trade Agreement and non-Free Trade Agreement countries. These companies also need to file with the Federal Energy Regulatory Commission (FERC) for approval to construct LNG export facilities. Sabine Pass is the only company that has received FERC's approval to construct liquefaction facilities in Sabine Pass, Louisiana. This terminal is expected to start service in 2016.
Overview
Net imports
Strong natural gas exports and lower imports reduced net imports to around 1,516 Bcf in 2012, the lowest level since 1990.
- Total imports decreased by 10 percent to 3,135 Bcf in 2012. Pipeline and LNG imports decreased by 5 percent to 2,961 Bcf and by 50 percent to 175 Bcf, respectively.
- Total exports increased by 8 percent to 1,619 Bcf in 2012. Pipeline exports increased by 11 percent to 1,591 Bcf and offset decreases in LNG exports and re-exports.
Prices
In 2012, the United States experienced its warmest year on record in the lower 48 states, high natural gas storage inventories, and high natural gas production that put significant downward pressure on domestic natural gas prices. These factors contributed to a decrease in natural gas prices at the Henry Hub to about $2.75 per thousand cubic feet (Mcf) on average in 2012, the lowest level since 1999.
The ability to export and sell natural gas produced in North America to other regions around the world remains limited. Some regions are experiencing significant increased natural gas demand, particularly in Asia. North America is still in the process of building liquefaction infrastructure that will enable it to export natural gas as liquefied natural gas (LNG) overseas. The United States has only one liquefaction plant for exporting LNG in Kenai, Alaska.
2012 import and export price highlights:
- Prices for LNG imports, pipeline imports, and pipeline exports largely follow domestic supply prices, as represented at the Henry Hub. In 2012, pipeline import and export prices decreased by about 30 percent. The Henry Hub price and the LNG import price experienced decreases of a similar magnitude.
- LNG import prices decreased by 24 percent, while LNG re-export prices increased by 16 percent. This widened the price difference between LNG re-exports and LNG imports to around $7.15 per Mcf. This price gap partially explains why the United States re-exported LNG over the past few years.
- In 2012, LNG export prices increased 22 percent to $15.62 per Mcf. Significant price increases for LNG exports to Japan reflect the additional natural gas demand for power generation after the Fukushima incident in 2011, which reduced Japan's nuclear power generation.
Imports, exports and re-exports by country
Imports
Gross natural gas imports decreased by about 10 percent to 3,135 Bcf in 2012, the lowest level since 1998.
- Around 94 percent of U.S. natural gas imports arrived via pipeline from Canada and Mexico. Pipeline imports from Canada and Mexico decreased by about 5 percent to 2,960 Bcf and by 88 percent to 0.3 Bcf, respectively. Pipeline imports from Canada have decreased almost every year since 2007. However, the decreasing trend does not apply to each region of the United States. Each region behaves differently, depending on the locations of supply sources and pipeline systems. Natural gas imports from Canada in the eastern part of the United States decreased significantly in 2012 due to increased natural gas production from the Marcellus shale region in the Northeast, which displaced natural gas imports from Canada. In contrast, natural gas imports from Canada in the western part of the United States increased slightly in 2012 and remained relatively stable compared with levels in previous years.
- LNG imports decreased by 50 percent from the 2011 level to 175 Bcf, the lowest level since 1999. LNG imports from Qatar and Trinidad and Tobago comprised about 84 percent of total LNG imports. LNG imports were lower from all trading partners, particularly from Egypt, Qatar, and Yemen. A combination of several natural gas pipeline disruptions in Yemen that reduced Yemen's LNG production for exports and increased LNG demand in Asia likely contributed to the decrease of LNG imports into the United States.
Exports and re-exports
Total natural gas exports increased by 8 percent to 1,619 Bcf in 2012, a new high. The growth in exports was driven by increased pipeline exports, which grew by 11 percent. This growth offset about a 42 Bcf decrease in LNG exports and re-exports.
- Pipeline exports accounted for 98 percent of U.S. total natural gas exports. Pipeline exports to Canada increased by 4 percent to 971 Bcf, while pipeline exports to Mexico rose by 24 percent to 620 Bcf, a record level. Relatively low natural gas prices in the United States and increased natural gas demand in Mexico for power generation and industrial use likely contributed to the pipeline export increases to Mexico.
- LNG exports, most of which went to Japan in 2012, decreased by 43 percent to about 9 Bcf. The decrease resulted from limited natural gas supply from the mature North Cook Inlet gas field for liquefaction in Kenai, Alaska. The Kenai LNG terminal was scheduled to close in 2011 but ConocoPhillips, owner of the terminal, resumed operation because of new natural gas demand from Japan.
- LNG re-exports decreased by 65 percent to about 19 Bcf in 2012. Decreased LNG imports likely contributed to lower LNG re-exports.
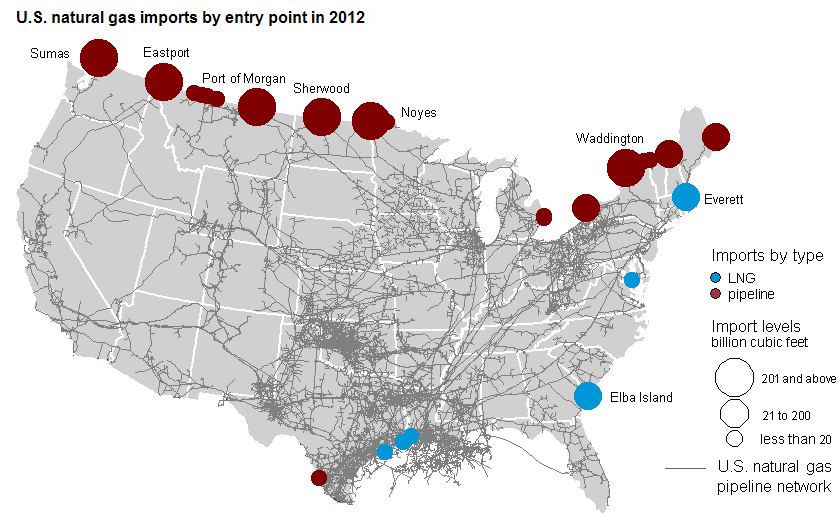
Imports by entry point
About 88 percent of all U.S. natural gas imports were received at six entry points (Port of Morgan, Eastport, Sherwood, Noyes, Sumas, and Waddington) in 2012.
- Pipeline imports at Port of Morgan, Eastport, Sherwood, Noyes, Sumas, and Waddington accounted for 93 percent of total pipeline imports from Canada.
- LNG imports at Everett, Massachusetts and Elba Island, Georgia accounted for 84 percent of total LNG imports. Everett is the most active entry point for LNG imports in the United States, representing 50 percent of total LNG imports. Everett's imports came from Trinidad and Tobago and Yemen with 70 Bcf and 17 Bcf, respectively. While total LNG imports decreased by about 50 percent in 2012, LNG imports at Everett decreased by 36 percent from 2011 level. Natural gas pipeline disruptions in Yemen during 2012 contributed to lower LNG imports at Everett. LNG imports at the Everett LNG terminal continue to be an important supply source to New England during peak demand because of existing pipeline constraints in New England that hinder natural gas flow from the Marcellus shale play and Gulf Coast into this region.
Note: LNG exports to Mexico were delivered by truck. Re-exports are shipments of LNG to foreign countries that were previously imported, offloaded into above-ground LNG storage tanks, and then subsequently reloaded onto tankers for delivery to other countries.
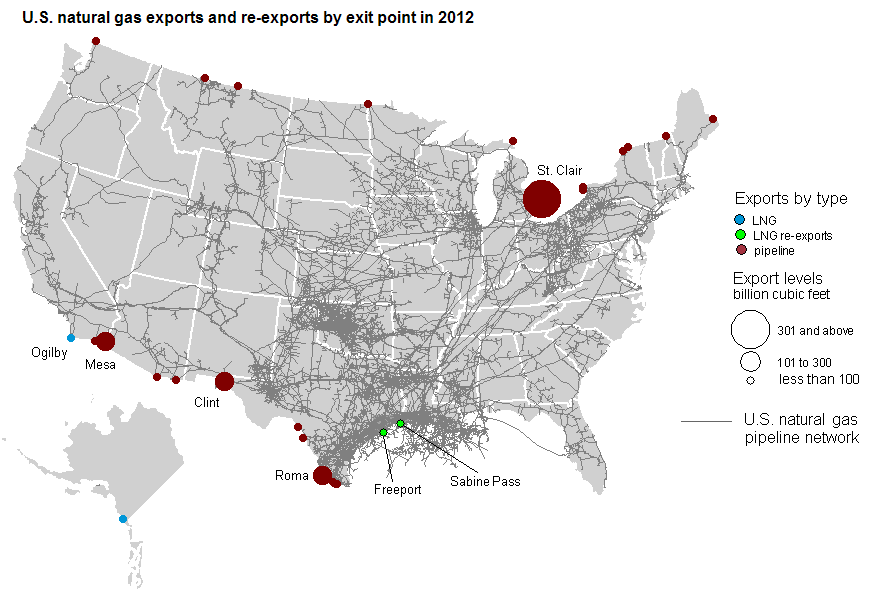
Exports and re-exports by exit point
About 68 percent of all U.S. natural gas exports was delivered through four exit points (St. Clair, Roma, Ogilby Mesa, and Clint) in 2012.
- Pipeline exports through St. Clair, Michigan accounted for about 78 percent of total exports to Canada, although some of the gas exported at St. Clair may originate in Canada.
- Pipeline exports through Roma, Ogilby Mesa, and Clint, totaling 338 Bcf, represented 55 percent of total pipeline exports to Mexico.
- All U.S. LNG re-exports were shipped from the Freeport and Sabine Pass LNG terminals. Re-exports at Freeport accounted for 59 percent of total LNG re-exports.
NOTE: Data as of February 2013 from April 2013 Natural Gas Monthly
See also: Natural Gas Imports and Exports - Quarterly Reports (Office of Fossil Energy, U.S. Department of Energy's Natural Gas Regulatory Program)