Production Decline Curve Analysis in the Annual Energy Outlook
Release date: March 16, 2023
This analysis was conducted for AEO2022 and has been discontinued.
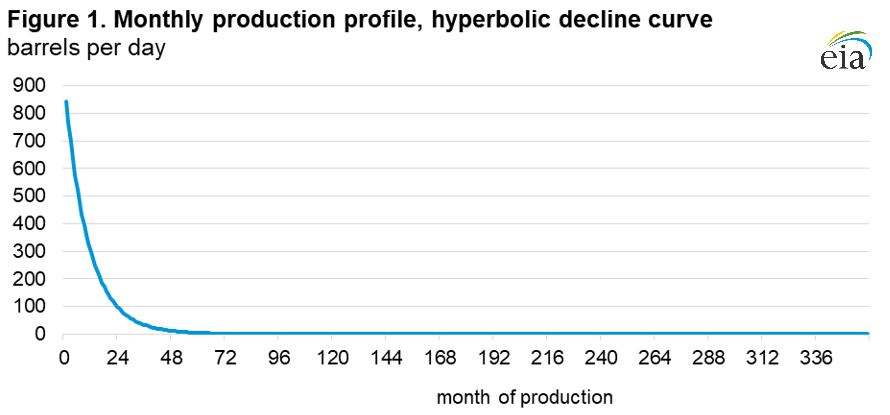
A key assumption in evaluating the expected profitability of drilling a well is the estimated ultimate recovery (EUR) of the well. EIA uses an automated routine to analyze the production decline curve of shale and tight oil and natural gas wells. The hyperbolic decline curve gives a general estimate of production for a specific month as

The initial production rate, parameter, and initial decline rate are estimated from observed well-level production data. The first observed month of production is excluded from the decline curve estimation because the timing of the start of production in the first calendar month is unknown and could incorporate anywhere from 1 to 31 days of actual production. Production in all other months is normalized to 30.4 days. The decline curve converts from a hyperbolic decline to an exponential decline when the monthly decline rate falls to 0.8% (10% annual decline). An example of a production profile using a hyperbolic decline curve is shown in Figure 1.
The routine examines wells drilled since 2008 in tight and shale plays with at least four months of production so that EIA can evaluate the change in EUR over time. For every Annual Energy Outlook (AEO), the assumed EUR per well for each play is updated every summer to reflect the latest technological and operational improvements and is typically based on the production performance of wells drilled within the past two years. Generally, by the time the AEO is released in January, the most recent data are from 10 to 18 months earlier. This annual reevaluation is particularly important in those tight oil and shale gas plays that have been undergoing rapid development. For example, since 2003, drilling in most tight oil and shale gas plays has shifted from vertical wells to horizontal wells. EURs based on vertical well performance in these plays will not accurately estimate production from future drilling because the new wells are expected to be primarily horizontal.
The EUR for a well is calculated as the sum of the observed monthly production values plus the sum of the monthly production values estimated using the decline curve, starting the month after the last observed production month through month 360 (30 years in total). Because the EUR per well varies widely not only across plays but also within a play, each play within each basin is divided into subplays—first across states (if applicable) and then into counties. The shape of the average county-level EUR per well is determined by the following steps:
- Grouping the current wells in the county
- Averaging the production
- Fitting the average production to a hyperbolic decline curve using the curve-fitting routine described above
However, because the number of months each well has been in production will vary across wells in each county, production for each well is first extended to the maximum number of months a well has produced in the county. This approach reduces the skewing of the average to the older wells.