

EIA’s top accomplishments of 2019
For the U.S. Energy Information Administration (EIA), 2019 was truly a year of notable accomplishments. Check out these highlights of EIA products and programs in 2019.

New and improved electricity tools and resources
EIA launched a beta release of its Hourly Electric Grid Monitor, a redesigned and enhanced version of EIA’s existing U.S. Electric System Operating Data tool. The Hourly Electric Grid Monitor incorporates two new data elements: hourly electricity generation by energy source and hourly subregional demand for certain balancing authorities in the Lower 48 states. The enhanced tool also provides new and more flexible options for visualizing the data and allows users to create custom dashboards they can save and share. EIA also enhanced the Electricity Data Browser to simplify access to information about plant-level cooling water use and estimates of nitrogen oxides (NOx), sulfur dioxide (SO2), and carbon dioxide (CO2) emissions. The updated browser provides water withdrawal, discharge, consumption, and water-use intensity information for all cooling systems at each reporting plant. In addition, EIA added tables to its Electric Power Annual that show adjusted capacities and usage factors for the two primary energy storage technologies: pumped storage and batteries.

Enhanced analysis in EIA’s short-term forecasts
Beginning with the August edition of the Short-Term Energy Outlook (STEO), EIA added forecasts of wholesale electricity prices at hubs in 11 electricity supply regions in the Lower 48 states. EIA also began to forecast average peak-period wholesale electricity prices for each STEO electricity supply region, except Hawaii and Alaska. In addition, EIA published an in-depth analysis on the upcoming new regulations by the International Maritime Organization (IMO 2020). Because IMO 2020 will affect petroleum markets for several years, EIA’s STEO forecast and Annual Energy Outlook 2019 projections provide complementary insights into the effects of the regulations.

Interactive New England dashboard
To increase customer understanding of weather-related energy issues in New England, EIA released an interactive dashboard showing energy market conditions in that region. The dashboard will help analysts and interested participants examine many key aspects of the New England energy market such as
- Fuel diversification
- Wholesale price volatility
- Energy delivery dynamics
- The effect of weather on operations
- The effect of fuel prices on electricity prices
- Regional and onsite fuel stocks

Customizable and interactive State Energy Portal
On May 15, EIA launched a beta release of its new State Energy Portal. The portal provides greater access to more state-level U.S. energy data with interactive, customizable views of more than 150 charts, tables, and maps. Infographics show the overall energy context for the states, and state rankings provide a way to compare states. Users can download charts and embed them in their websites. EIA developed this tool in response to feedback from a wide variety of customers who use our state-level data.

Improved navigation and new interactive visualizations in Energy Explained
EIA redesigned its Energy Explained resource to include enhanced navigation features, a more user-friendly interface, interactive data visualizations, and more. Energy Explained is one of EIA’s most-visited resources. Energy Explained contains 168 articles, and the new layout and navigation make it easier for the public to learn more about energy and how it interacts with the economy and the environment.

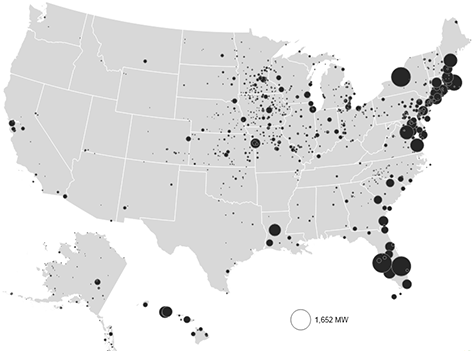
U.S. Biodiesel Plant Production Capacity Report
On September 13, EIA released its first annual U.S. Biodiesel Plant Production Capacity Report. The report includes the total biodiesel production capacity for all operating plants in both million gallons per year and in barrels per day as of January 1, 2019. The names of the reporting plants are organized by Petroleum Administration for Defense Districts (PADDs).

Key Statistics and Indicators in the State Energy Data System
In February, EIA added the Key Statistics and Indicators section to the State Energy Data System (SEDS), EIA’s comprehensive source for annual state energy statistics. The new section makes time-series data by state easier to access and provides state rankings tables for the year with the most current available data. The Key Statistics and Indicators section covers energy consumption and production data from 1960 to 2017 and prices and expenditures data from 1970 to 2017.

New liquids pipeline projects database
EIA launched a new liquids pipeline projects database that tracks more than 200 pipeline projects for crude oil, hydrocarbon gas liquids (HGL), and other petroleum products. The database contains project information such as project type, start date, capacity, mileage, and geographic information for historical (completed since 2010) and future pipeline projects. The information in the database is based on the latest public information from company documents, government filings, and trade press, but it does not reflect any assumptions on the likelihood or timing of project completion. The liquids pipeline projects database complements EIA’s natural gas pipeline projects table.

New play production data in shale gas and tight oil reports
EIA updated its methodology and production volume estimates for U.S. shale gas and tight oil plays to include seven additional plays. The update captures increasing production from new plays and from older plays that were declining but are now rebounding because of technological advances in horizontal drilling and hydraulic fracturing.
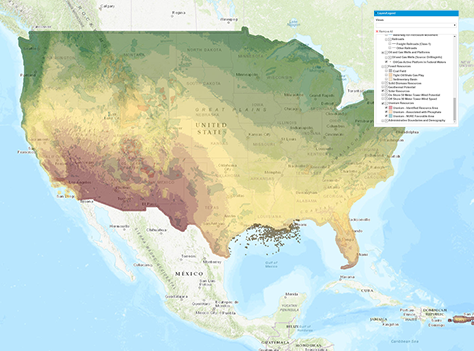
New detailed geographical information in the U.S. Energy Mapping System
EIA updated its U.S. Energy Mapping System to include several new layers. The uranium layers now show identified resource areas, uranium associated with phosphate, and National Uranium Resource Evaluation (NURE) favorable areas. Updated data layers include locations for electric substations, oil and natural gas platforms in federal waters, and solar resources.
Oil stock levels at power plants
EIA now publishes data on monthly and yearly plant-level oil stocks at electric power plants. Oil stocks data are collected monthly from more than 1,800 power plants; the annual data include plants that report monthly and about 5,800 additional plants.
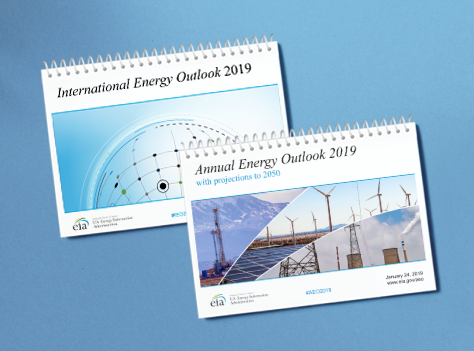
Projections for domestic and international energy markets
EIA released its Annual Energy Outlook 2019 (AEO2019) on January 24. It includes projections of U.S. energy markets through 2050 based on a Reference case and six side cases that include different assumptions regarding prices, economic activity, and technology and resource estimates. EIA Administrator Dr. Linda Capuano presented EIA’s findings at a public event hosted by the Bipartisan Policy Center. The event also included panel discussions about the latest AEO and the Short-Term Energy Outlook (STEO). On September 24, EIA released its International Energy Outlook 2019. The annual long-term assessment of world energy markets includes a Reference case and four side cases, which use different assumptions for the projections in each case. Dr. Linda Capuano presented the IEO’s projections at the Center for Strategic and International Studies (CSIS).