

EIA’s top accomplishments of 2016
For the U.S. Energy Information Administration (EIA), 2016 was truly a year of notable accomplishments. Check out these highlights from EIA programs in 2016.

More timely export data improve weekly petroleum consumption estimates
EIA now uses weekly export data from U.S. Customs and Border Protection to report petroleum export and consumption estimates in the Weekly Petroleum Status Report. Providing access to more timely crude oil and petroleum products data helps users make more accurate projections.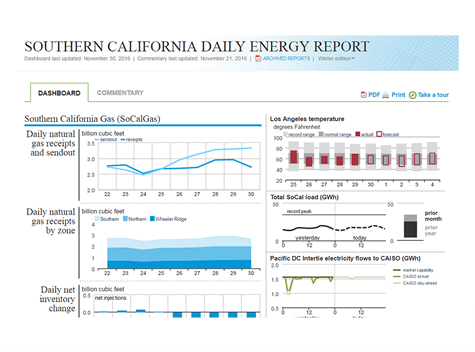
The Southern California Daily Energy Report provides natural gas and electricity market information to monitor impacts of Aliso Canyon natural gas storage problems
EIA's Southern California Daily Energy Report enables monitoring of the potential market effects of constraints at the Aliso Canyon natural gas storage facility. This daily report includes information for regional electricity and natural gas markets, with data on supply, demand, prices, and weather. As a result of a leak identified in October 2015 and plugged in February 2016, use of the Aliso Canyon natural gas storage facility has been restricted.

One-stop shop improves access to coal market information
EIA launched a new Coal Markets product with weekly coal production, prices, and monthly export data. This new product complements existing data tools such as EIA's Coal Data Browser, which provides information on aggregate production, mine-level data, and other coal data series.

New petroleum market reports expand upstream and downstream information
EIA's monthly Drilling Productivity Report (DPR) now includes a supplement with estimates of the number of drilled but uncompleted wells (DUCs) in the seven key oil and natural gas producing regions covered by the DPR. When producers are under stress, as has been the case since the large decline in oil and natural gas prices in recent years, changes in the number of DUCs can provide insight into upstream industry conditions. EIA also launched the What Drives Petroleum Product Prices webpage, which identifies and tracks several fundamental and financial market factors and complements the existing page What Drives Crude Oil Prices.
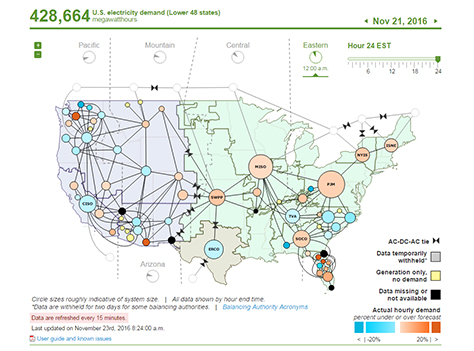
New hourly data on U.S. electric system operations deepens insight into electricity flows
EIA's U.S. Electric System Operating Data platform provides near real-time hourly electricity operating data, including actual and forecast demand, net generation, and power flows between electricity systems. This data and visualization, covering the contiguous 48 states, is the first hourly data collection and dissemination by a federal statistical agency.
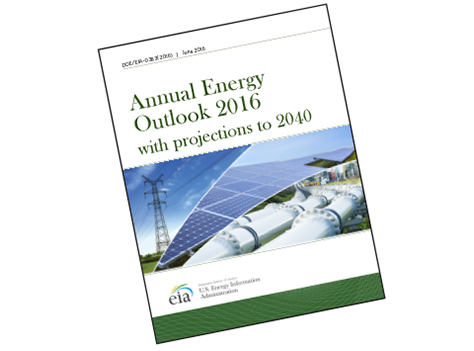
Annual Energy Outlook 2016 projects energy markets with and without the Clean Power Plan
EIA released the Annual Energy Outlook 2016 with projections of U.S. energy supply, demand, and prices through 2040. This year's outlook includes two cases based on whether or not the U.S. Environmental Protection Agency's Clean Power Plan (CPP) is implemented. The CPP would require reduced carbon dioxide emissions from existing fossil fuel-fired electricity generating units.

Data and analysis covering renewable energy sources and power plant construction costs are enhanced
EIA continues to work with stakeholders to ensure that the agency provides accurate data and high-quality projections for wind, solar, and other renewables. An extensive review of EIA's data and projections for wind and solar technologies is available in the EIA report, Wind and Solar Data and Projections from the U.S. Energy Information Administration: Past Performance and Ongoing Enhancements. EIA also recently began collecting construction costs for new electric generators at utility-scale power plants. Average costs by technology type and region are published in the new Construction Cost Data for Electric Generators Installed in 2013.

International Energy Outlook 2016 and expanded international engagement address global energy production and use and the implications for the United States
EIA's updated long-term assessment of global energy provides projections of world energy consumption and production by energy source for 16 regions of the world through 2040. EIA is actively engaged with experts and counterparts from Canada, Mexico, China, Japan, the Middle East, and South America through bilateral and multilateral dialogues, workshops, and meetings.

Commercial building characteristics and energy use data provide insights into key trends
EIA published the Commercial Buildings Energy Consumption Survey (CBECS) data from the most recent CBECS (a quadrennial survey) in a public-use microdata file, tables, and a summary report. The data cover 5.6 million commercial buildings in the population and allow data users to do custom analyses of energy characteristics and consumption data.

Enhanced interactions with experts, stakeholders, and state and local officials improve the quality and value of EIA information
EIA strengthened relationships with state, county, and local stakeholders through hosting and participating in energy conferences, workshops, teleconferences, and by creating more effective ways to share the agency's products and data. More than 900 representatives from industry, government, and academia attended the 2016 EIA Energy Conference in Washington, DC, to discuss current and future challenges facing domestic and international energy markets and policymakers.