
Hybrid sales rise while battery electric sales remain lower after tax credit expiration
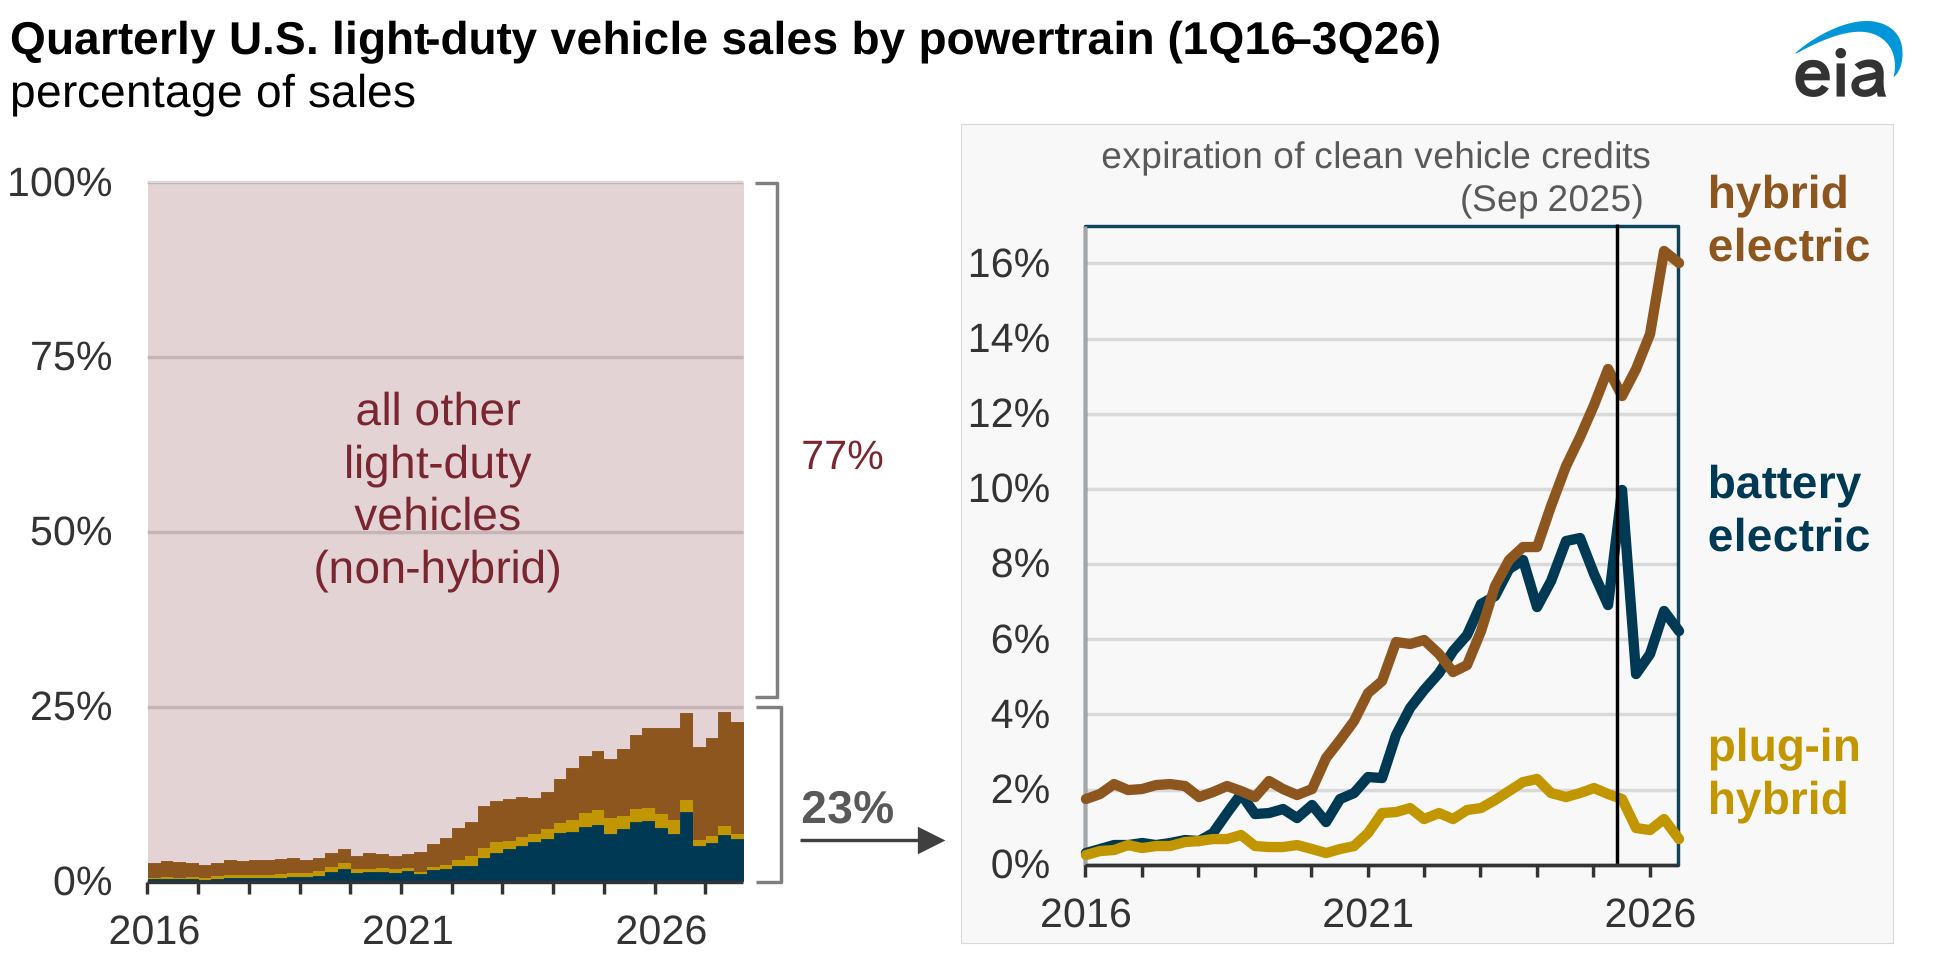
Note: 1Q16=first quarter 2016; 3Q26=third quarter 2026
In the third quarter of 2026 (3Q26), 23% of new light-duty vehicles sold in the United States were hybrid electric, battery electric, or plug-in hybrid electric vehicles, down slightly from 24% in 3Q25. Between 3Q25 and 3Q26, hybrid electric vehicles continued to gain market share, reaching 16% of light-duty vehicle sales. Growth of hybrid electric vehicle sales has slowed this quarter as the average transaction price for a new vehicle passed $50,000—the first time this price has been reached so far this year, according to Kelley Blue Book.
The market shares of battery electric and plug-in hybrid electric vehicles decreased over the same period, according to estimates from Omdia. In 3Q26, battery electric vehicle sales were 6% of new light-duty vehicles sold, down from 10% in 3Q25; plug-in hybrid electric vehicle sales fell from 1.8% to 0.7% over the same period.
These vehicle types affect the broader energy sector in different ways. Battery electric and plug-in hybrid electric vehicles consume electricity from the grid, which affects electricity demand. By comparison, hybrid electric vehicles consume liquid fuels and do not connect to the grid. Hybrid vehicles were not eligible for any of the federal tax credits that expired in September 2025.
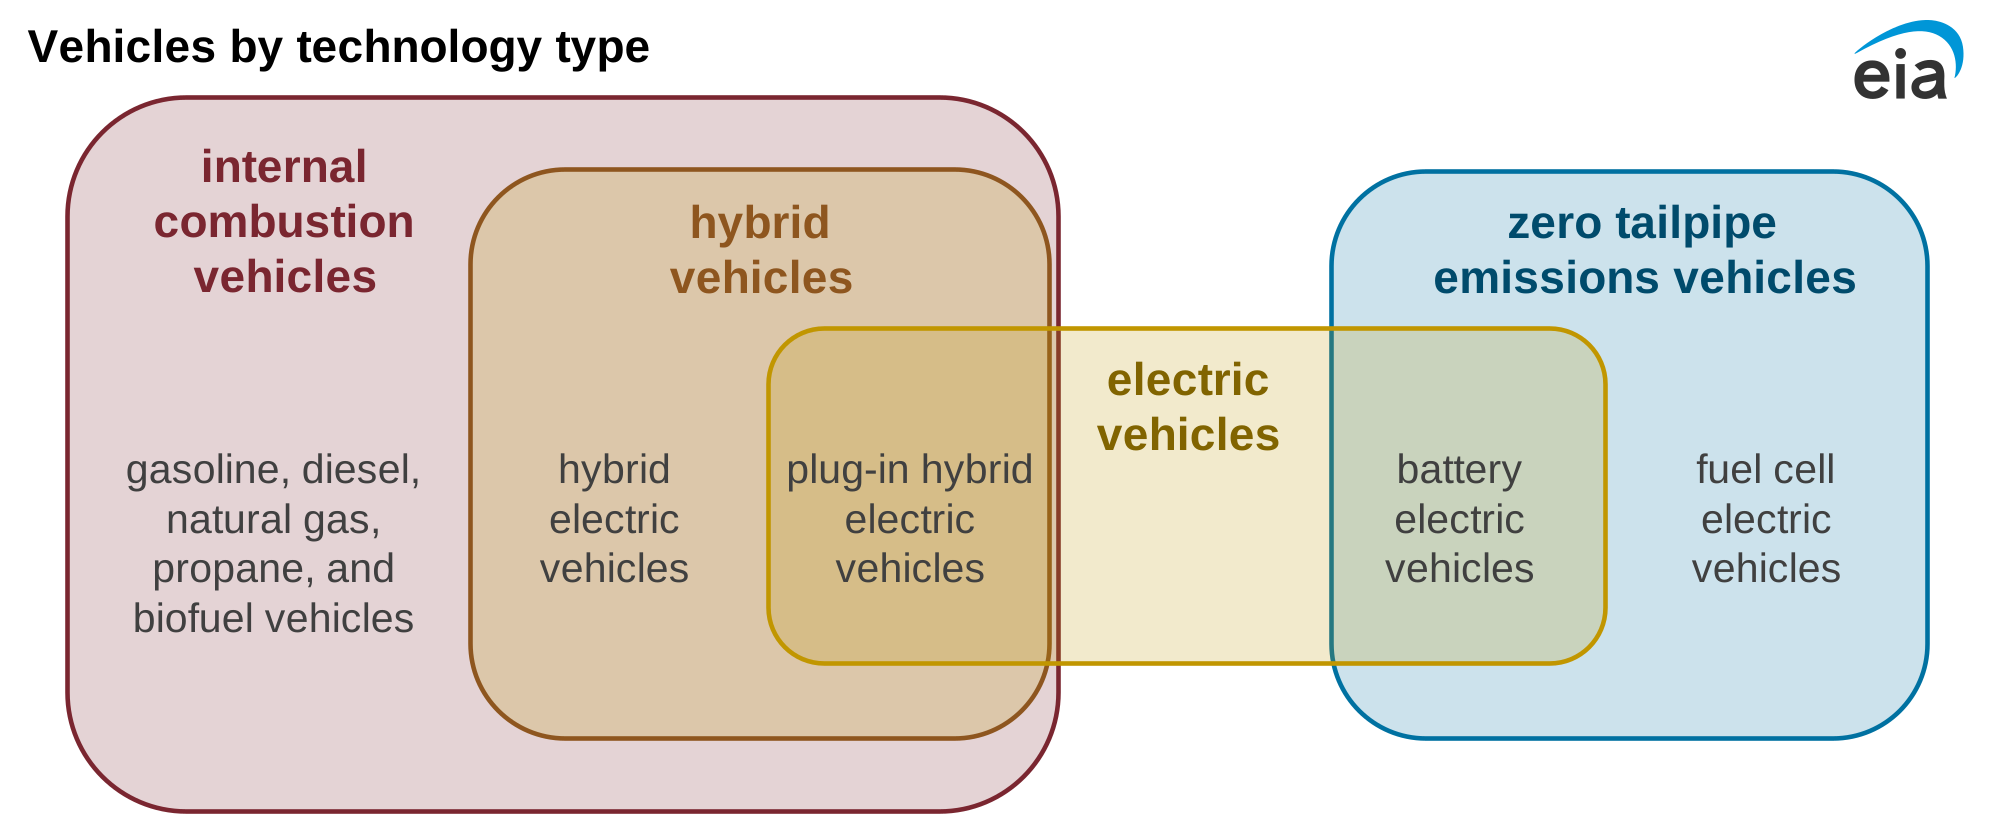
Two tax credits for purchasing or leasing new electric vehicles expired on September 30, 2025: the New Clean Vehicle Credit and the Qualified Commercial Clean Vehicle Credit. Battery electric vehicles made up a record 12% of light-duty vehicle sales in September 2025, immediately before the credits expired. However, 2025 marked the first year where annual sales and market share of battery electric vehicles declined, a trend that has continued in 2026. Battery electric vehicle sales fell to 6% of new vehicle sales in the first nine months of 2026, down from 8% over the same period in 2025.
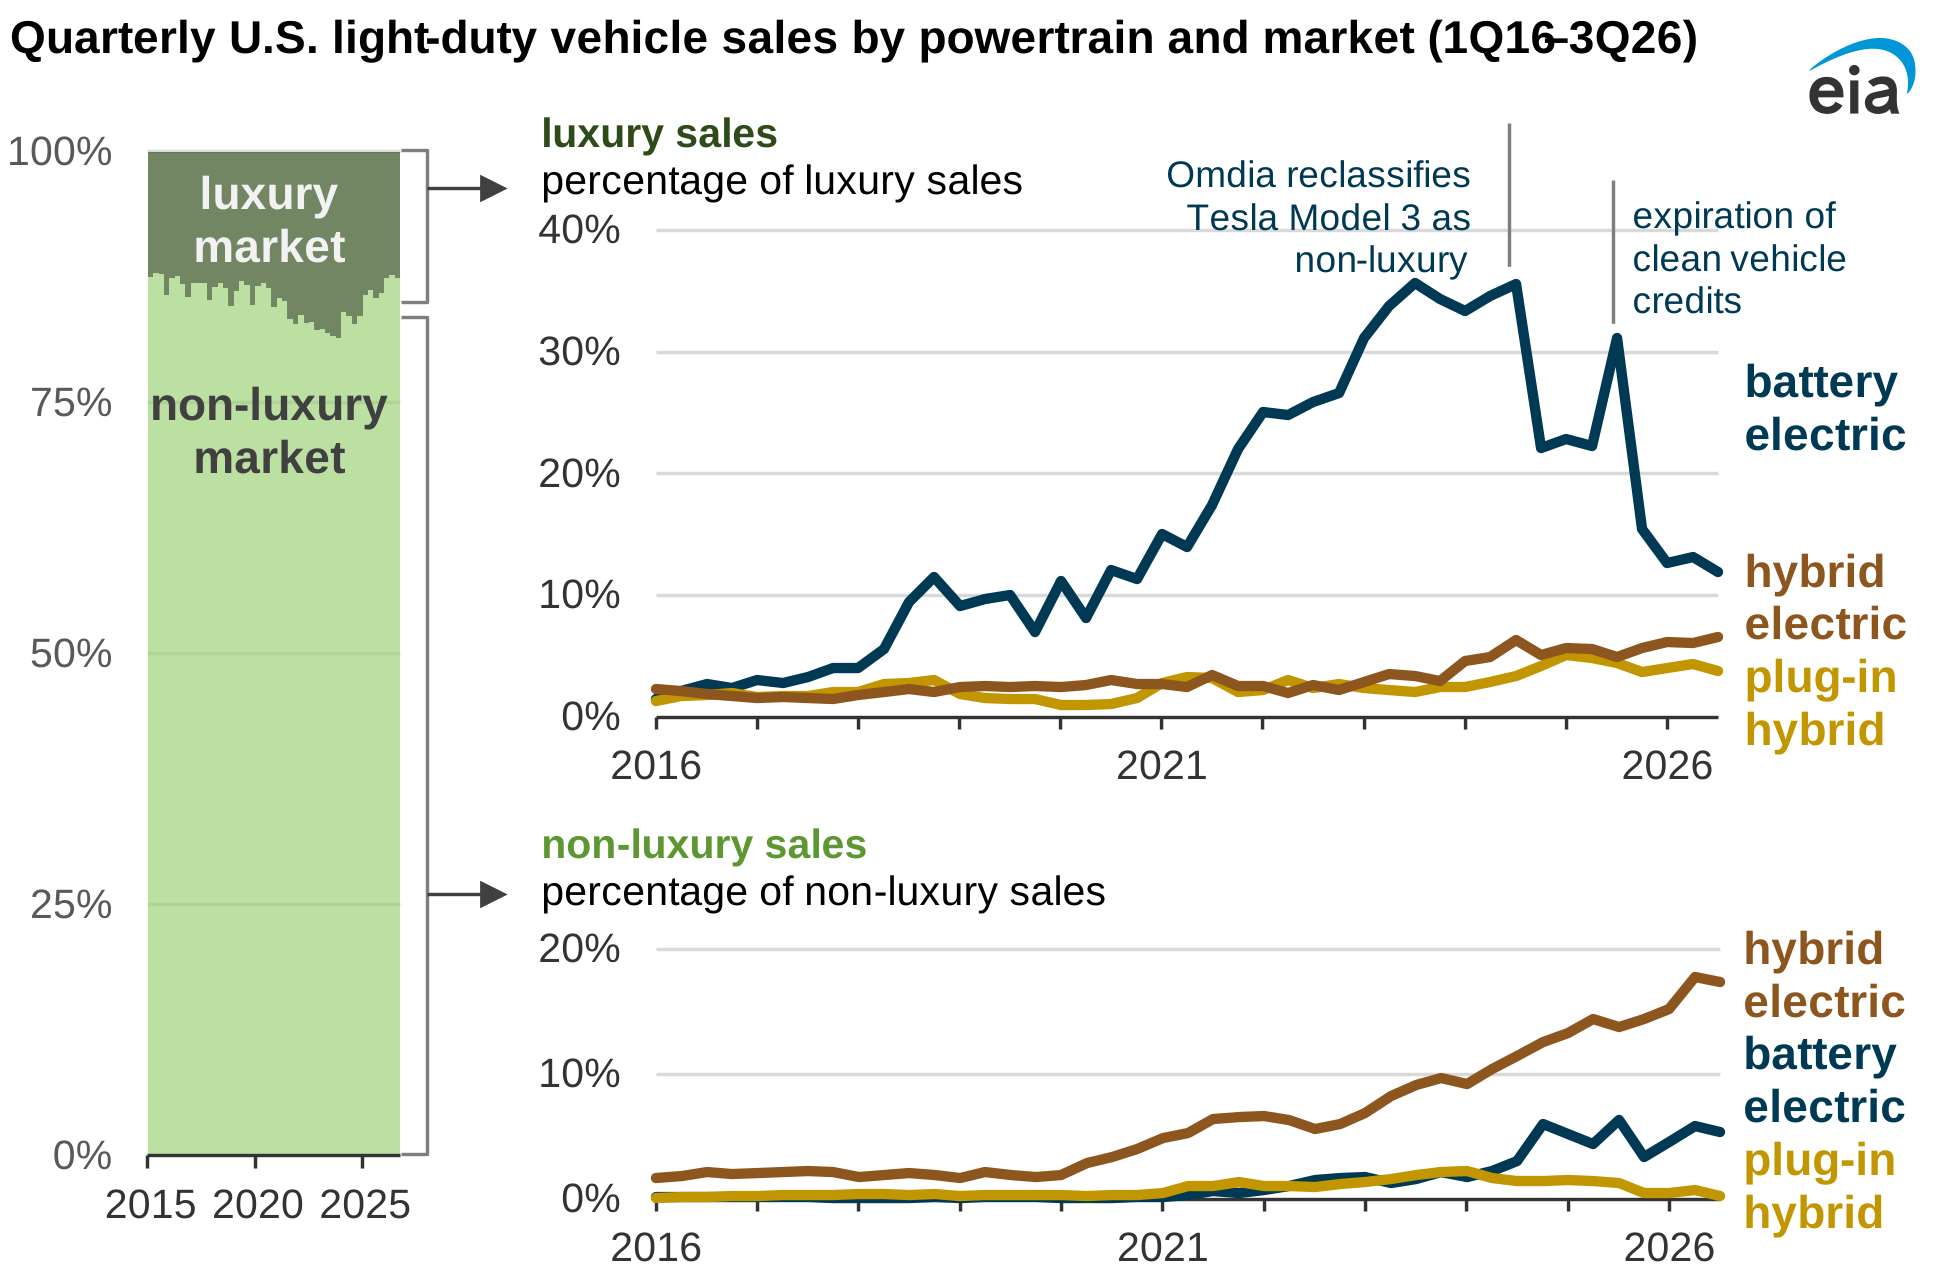
Battery electric vehicles have historically been more popular in the U.S. luxury vehicle segment, which accounted for 12% of the total U.S. light-duty vehicle sales in 3Q26. However, sales in this segment are also declining. In 3Q26, battery electric vehicles accounted for 12% of luxury light-duty vehicle sales, down from 31% in 3Q25 prior to the expiration of the clean vehicle tax credits.
Because sales figures in any year are relatively small compared with the total number of vehicles on the road, electric vehicles’ share of the light-duty vehicle fleet is much less than the recent total 6% sales share in 3Q26. In 2024, the most recent year for which we have fleet-wide data available in our Monthly Energy Review, electric vehicles accounted for 2% of all registered light-duty vehicles in the United States.
Principal contributors: Matthew Skelton, Michael Dwyer
Tags: sales, vehicles, transportation, electricity, gasoline