
U.S. Northeast is relying less on electricity imports from Canada
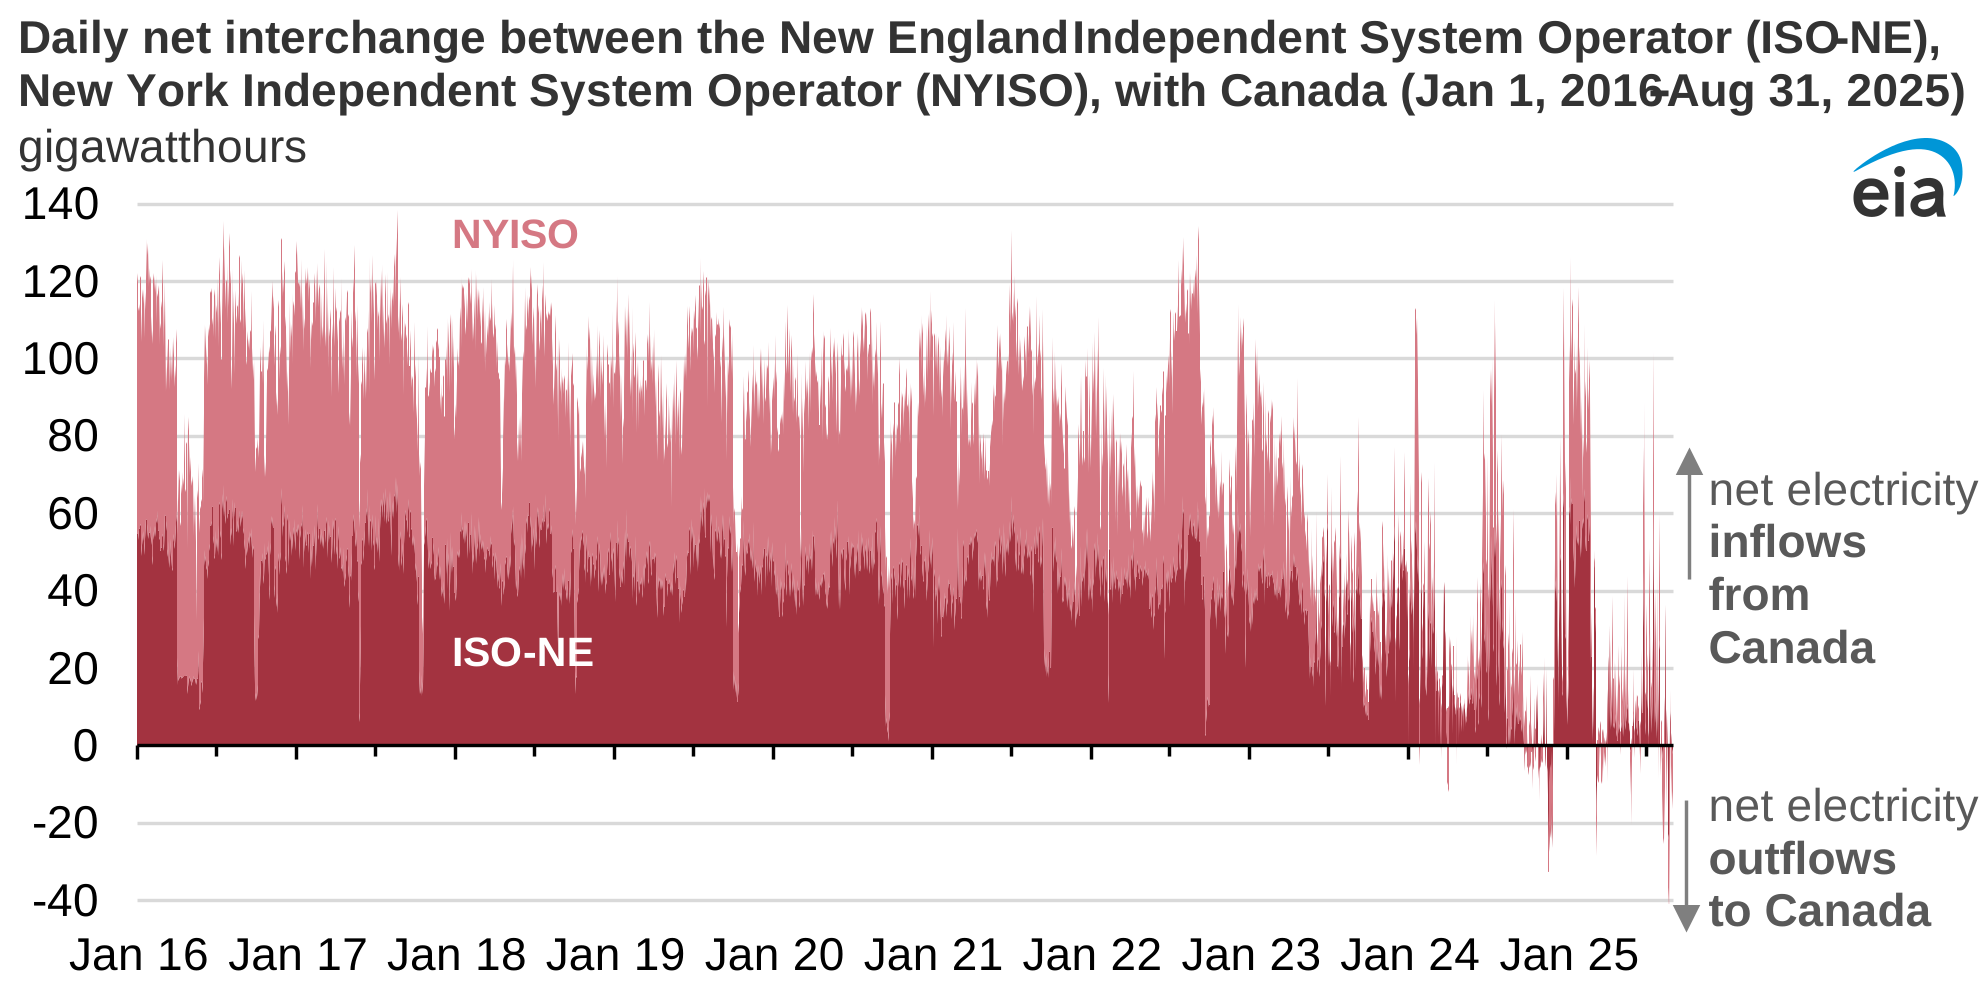
Over the past few years, net electricity inflows from Canada into New York (New York Independent System Operator, or NYISO) and New England (Independent System Operator of New England, or ISO-NE) have decreased. We identified this trend in an analysis in 2024, and the trend has continued through the first eight months of 2025. From January through August 2025, daily net electricity imports from Canada into ISO-NE averaged less than 40% of those occurring over the same months in 2022. During the same period, NYISO and Canada net trade fell to 25% what it was during the same months of 2022.
Two factors contributed to the falling imports from Canada. First, drought conditions have led to less hydropower electricity generation in Canada throughout most of the past three years. Despite parts of Canada receiving above average rainfall in July, drought conditions have persisted across much of the country, according to the Canadian government’s Drought Monitor. Second, electricity demand in both ISO-NE and NYISO has fallen. Between 2016 and 2024, electricity demand in ISO-NE fell 9%, and demand in NYISO fell 6%.
Although NYISO and ISO-NE typically import electricity from Canada, the shifting trends have led to multiple days of net electricity exports into Canada from the two ISOs. Net electricity exports from these two grid operators to Canada are more common in the shoulder seasons (spring and fall) when electricity demand in the U.S. Northeast is relatively low. In summer and winter, relatively high electricity demand in the U.S. Northeast limits the electricity available for export.
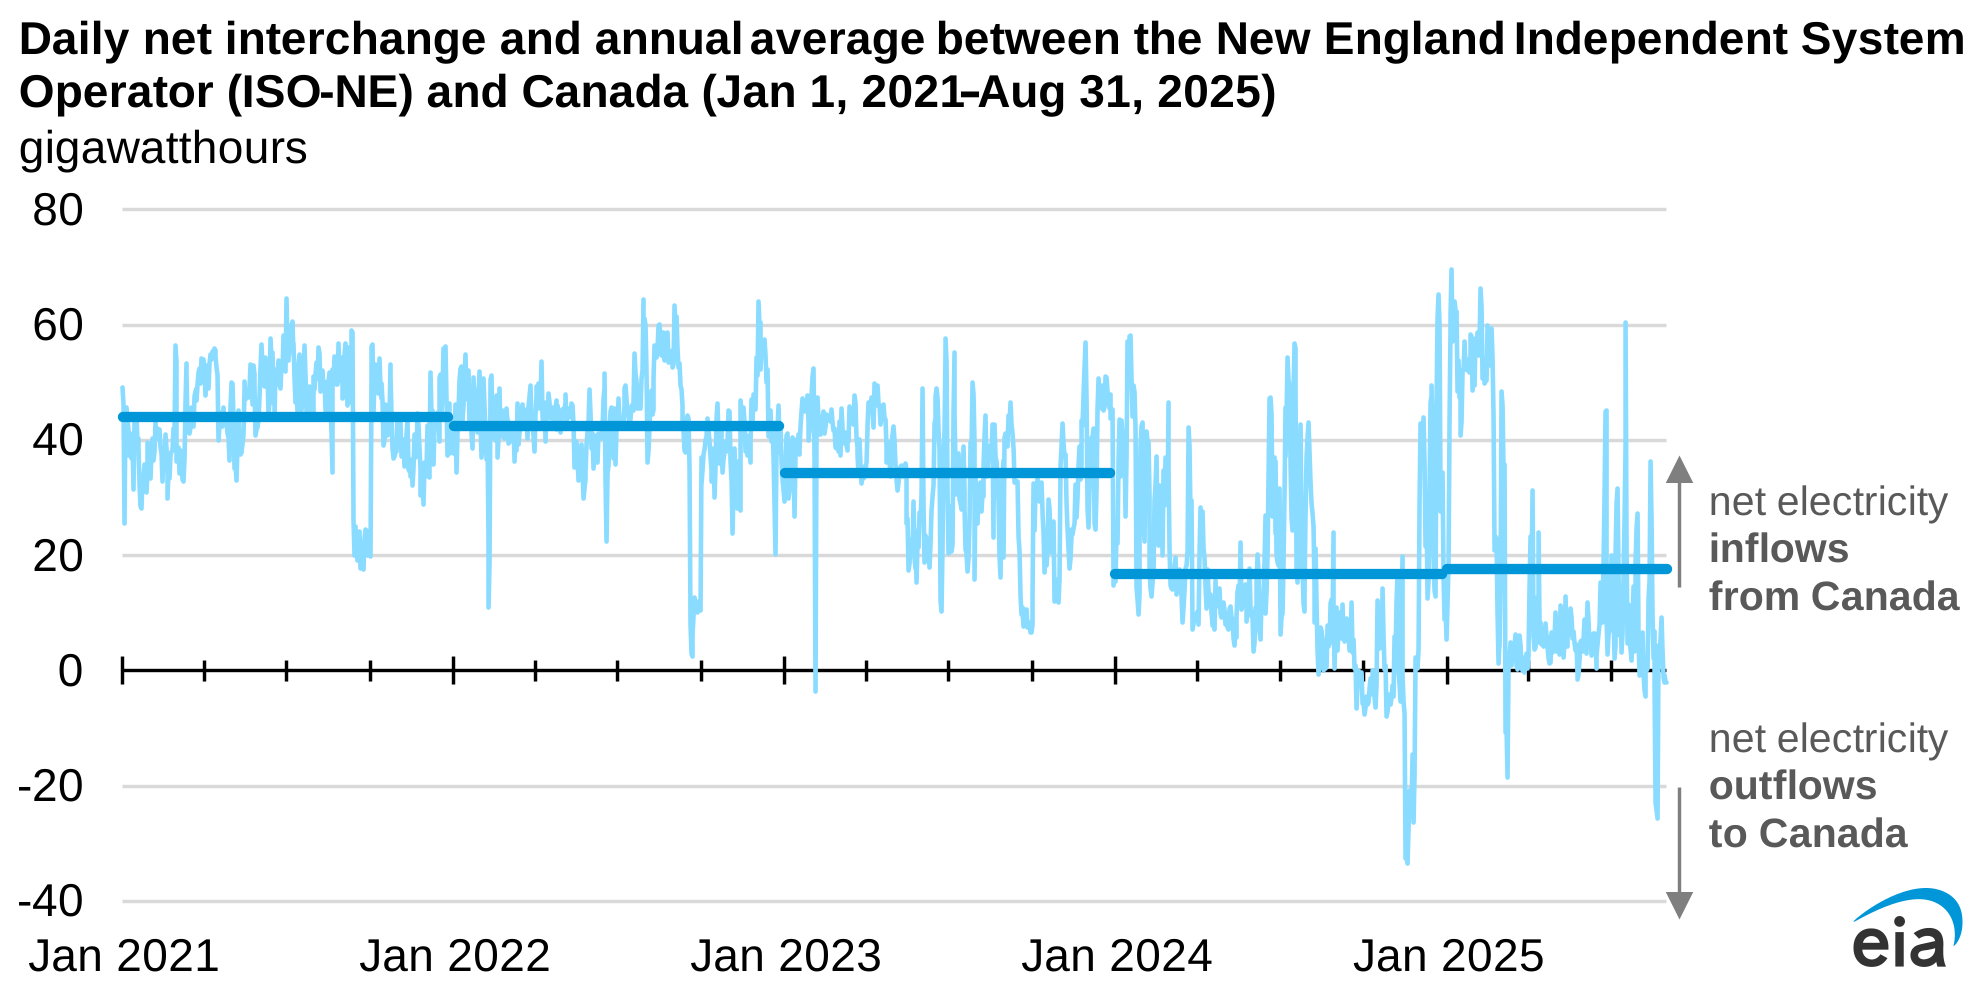
When electricity demand in New England is relatively high, electricity imports from Canada have a key role in meeting that demand. For example, in January 2025, the month winter demand peaked in ISO-NE, Canada provided an average of 14% of ISO-NE electricity demand. But the average over the first eight months of 2025 was 5%. In previous years, Canada contributed a higher share of electricity, providing an average of 14% of ISO-NE’s electricity between 2016 and 2022. That share fell to 11% in 2023 and to 5% in 2024.
ISO-NE first exported more electricity than it imported from Canada, becoming a net exporter, on a daily basis in February 2023. Daily net exports have become increasingly common, occurring 49 times in 2024 and 20 times through August 31 in 2025, according to data collected in our Hourly Electric Grid Monitor.
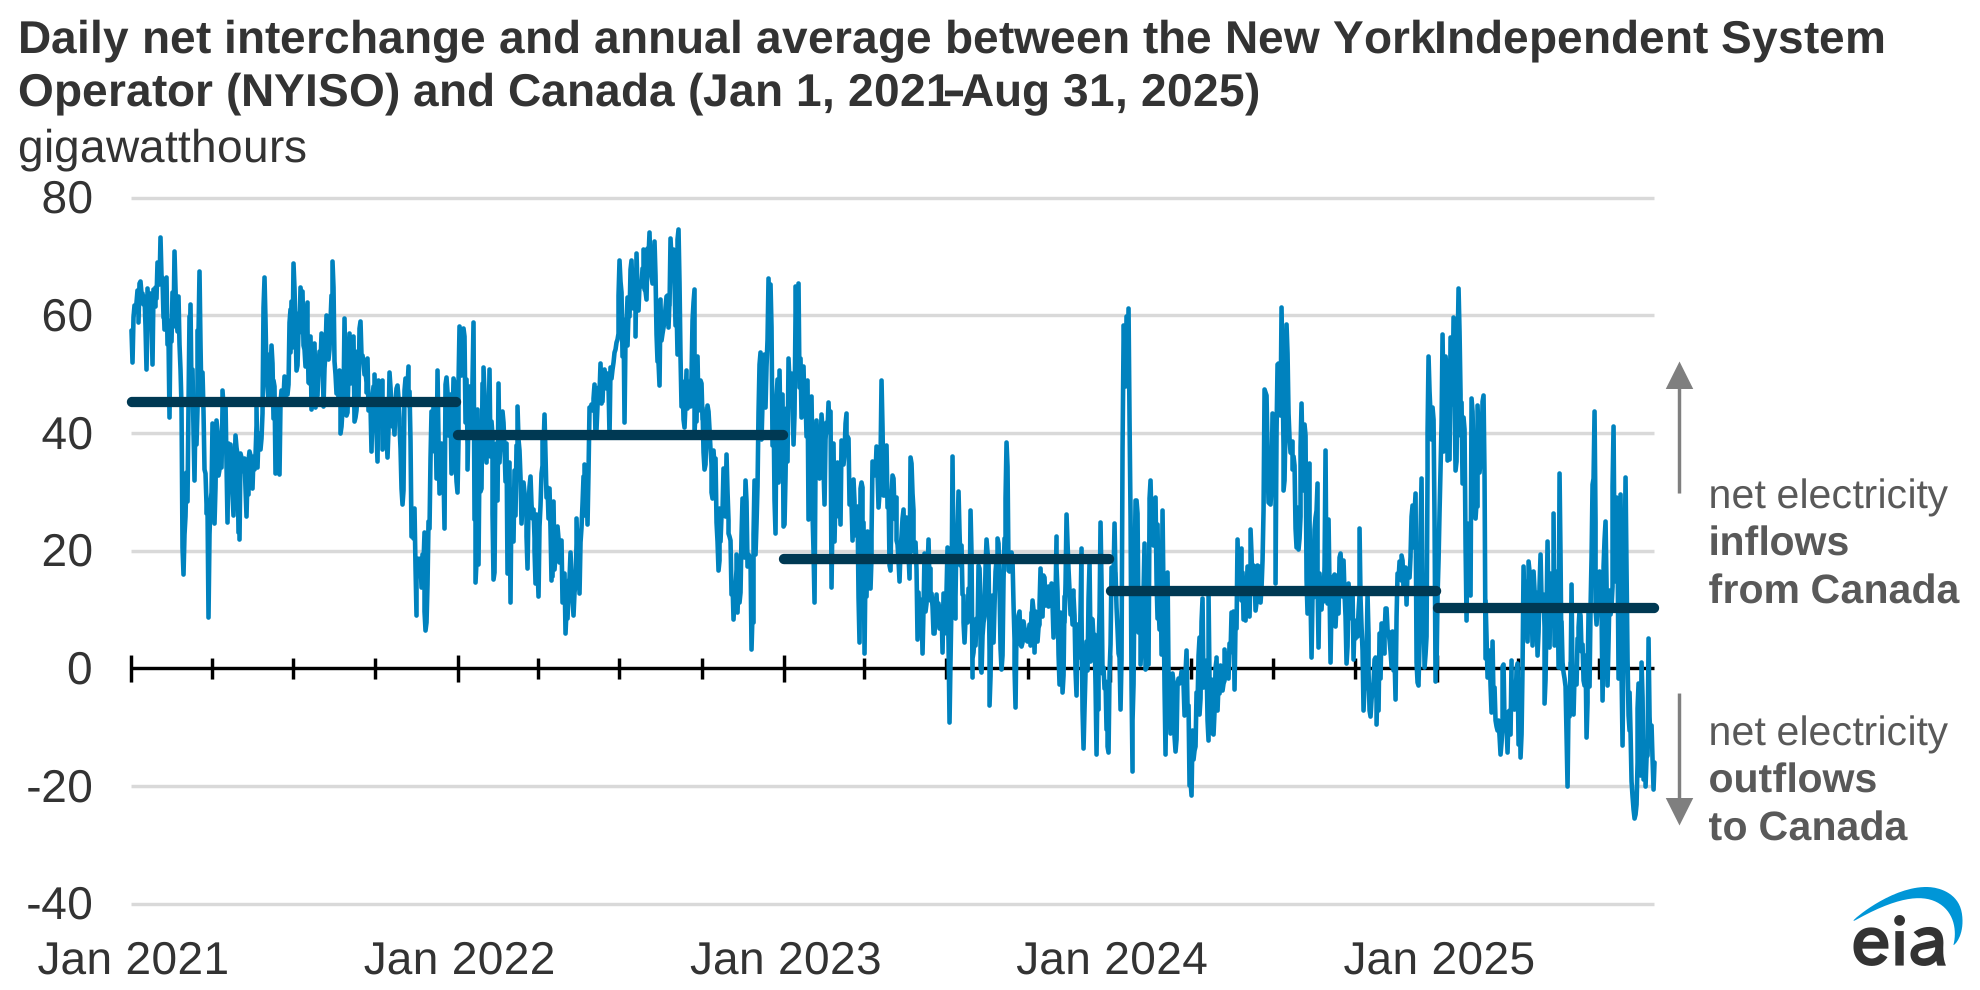
As in ISO-NE, Canadian electricity imports to NYISO are an important component in meeting electricity demand, but the amount of electricity imported from Canada has decreased in recent years. Between 2016 and 2022, Canadian electricity imports provided 11% of NYISO electricity. In 2023, that share fell to 5%, and in 2024 it fell to 3%. Through August 31, 2025, Canadian electricity imports remained about 2% of NYISO electricity demand. In August 2025, NYISO was a net exporter to Canada every day except for three during the month.
NYISO was a daily net exporter of electricity to Canada for the first time in July 2023. In 2024, NYISO was a net exporter to Canada for 87 days. In 2025, through the end of August, NYISO was a daily net exporter 86 times.
Principal contributor: Kimberly Peterson
Tags: Northeast, exports/imports, electricity, Canada