
Midwest homes, notably older homes, consume more natural gas than most other U.S. homes
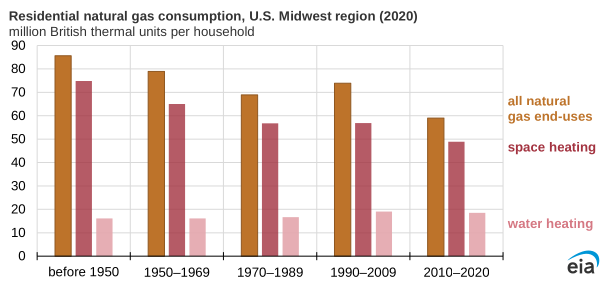
Note: Average consumption for homes that use natural gas for the specified end use.
Homes in the Midwest consumed 34% more natural gas than the national average—76.1 million British thermal units (MMBtu) per household compared with 56.6 MMBtu nationally—according to our 2020 Residential Energy Consumption Survey (RECS). The newest midwestern homes, those built since 2010, consumed an average of 48.9 MMBtu of natural gas for space heating, and homes built before 1950 consumed an average of 74.8 MMBtu.
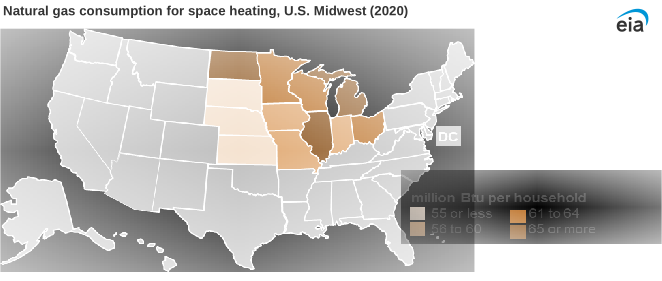
Note: Average consumption for homes that use natural gas for space heating. Btu=British thermal units.
Space heating is by far the largest end use of energy in the U.S. residential sector; it accounts for 53% of all energy consumption in Midwest homes. Differences in winter temperatures as well as structural differences can affect space-heating energy consumption. For example, older homes in the Midwest are less likely to report having adequate insulation. Of the midwestern homes built before 1970, 27% reported having poor or no insulation, compared with just 11% of homes built since 1970.
In 2020, average household natural gas consumption for space heating in the Midwest ranged from 72.7 MMBtu in Michigan to 50.9 MMBtu in Kansas. Although average home sizes and types were similar between the two states, average temperature was not. In 2020, Michigan had an average temperature of 49.6°F, making it the 11th coldest state in the United States. Kansas had an average temperature of 56.0°F, making it the 29th coldest state.
Natural gas consumption for water heating in the Midwest did not follow the same consumption pattern as space heating. Homes in Michigan averaged 16.6 MMBtu annually for water heating compared with an average of 17.8 MMBtu in Kansas. Homes built before 1950 consumed an average of 16.1 MMBtu of natural gas for water heating, and homes built on or after 2010 consumed 18.5 MMBtu annually.
The 2020 RECS study collected data for 18,496 households, the largest sample in the program’s history. We arrived at estimates for space heating and other end-use consumption from modeled expectations using engineering parameters. We then calibrated the initial estimates to respondent utility billing data. End-use estimate documentation as well as detailed tables are available on our RECS site.
Principal contributors: Kaili Diamond, Bill McNary