
Over one-third of natural gas produced in North Dakota is flared or otherwise not marketed
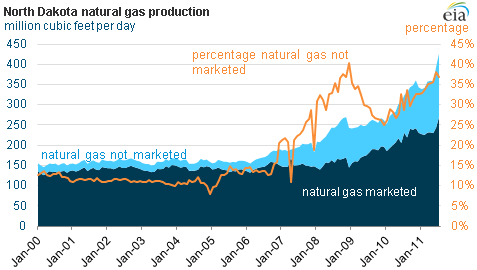
Natural gas production in North Dakota has more than doubled since 2005, largely due to associated natural gas from the growing oil production in the Bakken shale formation. Gas production averaged over 485 million cubic feet per day (MMcfd) in September 2011, compared to the 2005 average of about 160 MMcfd.
However, due to insufficient natural gas pipeline capacity and processing facilities in the Bakken shale region, over 35% of North Dakota's natural gas production so far in 2011 has been flared or otherwise not marketed. (It is generally better to flare natural gas than to vent it into the atmosphere because natural gas—methane—is a much more powerful greenhouse gas than carbon dioxide.) The percentage of flared gas in North Dakota is considerably higher than the national average; in 2009, less than 1% of natural gas produced in the United States was vented or flared.
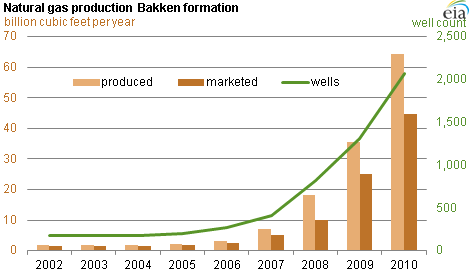
Natural gas production in the Bakken shale. North Dakota natural gas production from the Bakken shale, which is situated in the northwest portion of the State, increased more than 20-fold from 2007 to 2010, and the number of wells producing natural gas increased 7-fold.
Natural gas infrastructure. The necessary natural gas infrastructure—gathering pipelines, processing plants, transportation pipelines—surrounding the Bakken shale play has not expanded at the same pace, effectively stranding the natural gas that is produced during oil production. A 2010 report by the North Dakota Pipeline Authority highlights an example of this, stating that one county was able to reduce its flaring from December 2008 to December 2009 by 62% with the addition of two new natural gas plants and the expansion of associated gas gathering systems. The report also details several other projects that have either come online recently or are planned to for the immediate future, which may reduce the amount of natural gas flared.
Natural gas flared or otherwise not marketed. The North Dakota Department of Mineral Resources estimated that in May 2011, nearly 36% of the natural gas produced did not make it to market. Most of this gas—29% of the total gas produced—was flared. The remaining natural gas that did not make it to market—7% of total gas produced—is unaccounted for or lost, which means the gas may have been used as lease and plant fuel, or encountered losses during processing or transportation.
Natural gas flaring regulations. According to current North Dakota state regulations, producers can flare natural gas for one year without paying taxes or royalties on it, and can ask for an extension on that period due to economic hardship of connecting the well to a natural gas pipeline. After one year, or when the extension runs out, producers can continue flaring but are responsible for the same taxes and royalties they would have paid if the natural gas went to market.
Tags: Bakken, drilling, natural gas, North Dakota, production/supply, shale, states