
U.S. oil reserves continue rising, surpass 36 billion barrels for first time since 1975
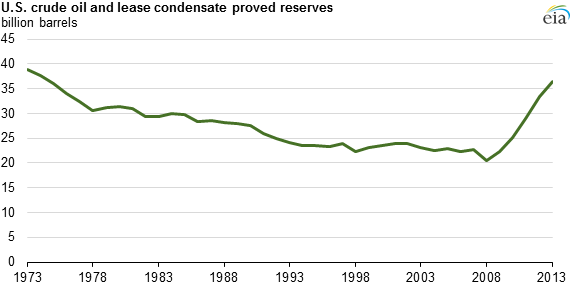
U.S. crude oil and lease condensate proved reserves rose for the fifth consecutive year in 2013, increasing by 9% from the 2012 level to 36.5 billion barrels, according to the U.S. Crude Oil and Natural Gas Proved Reserves, 2013 report released yesterday by the U.S. Energy Information Administration (EIA). U.S. crude oil and lease condensate proved reserves surpassed 36 billion barrels for the first time since 1975.
Proved reserves
Proved reserves are those volumes of oil and natural gas that geological and engineering data demonstrate with reasonable certainty to be recoverable in future years from known reservoirs under existing economic and operating conditions.
North Dakota had the largest increase (1.9 billion barrels, 51%) in oil reserves among individual states in 2013, based on development of the Bakken/Three Forks formation in the Williston Basin. With 5.7 billion barrels of proved reserves, North Dakota has more reserves than the federal offshore waters of the Gulf of Mexico. Texas remains by far the leading state in total proved oil reserves—its reserves increased from 11.1 billion barrels in 2012 to 12 billion barrels in 2013 (an 8% increase). The largest decline of 2013 was in Alaska, where proved reserves decreased by 454 million barrels, due mainly to reduced well performance at large existing oil fields.
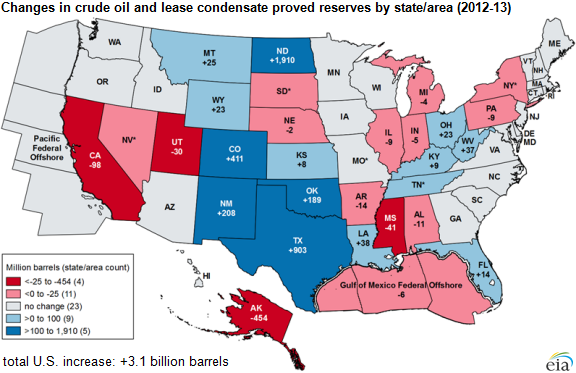
Note: * data withheld to avoid disclosure of individual company data
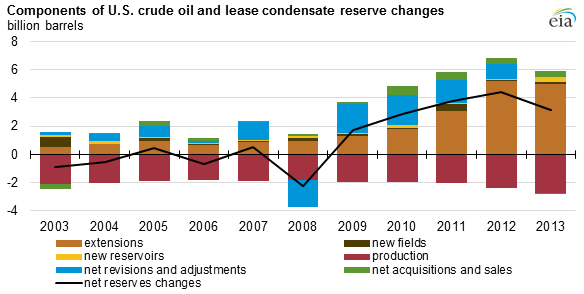
Changes in reserves reflect exploration and development activities as well as financial factors. Increases in crude oil and lease condensate reserves in 2013 were mainly attributable to nearly 5 billion barrels of extensions to existing fields. Extensions are the result of additional drilling and exploration in previously discovered reservoirs, and have accounted for the majority of reserves increases over the past three years. Continued development of the Bakken/Three Forks play in North Dakota accounted for a large portion of the reserves additions, and overall, tight oil plays accounted for almost 30% of all U.S. crude oil and lease condensate proved reserves.
EIA's estimates of proved reserves are based on an annual survey of domestic oil and gas well operators. For more information, read the full U.S. Crude Oil and Natural Gas Proved Reserves, 2013 report.
Principal contributor: Steven Grape
Tags: crude oil, liquid fuels, map, oil/petroleum, reserves, states