U.S. Energy Information Administration logo
Skip to sub-navigation
March 24, 2014

China is now the world’s largest net importer of petroleum and other liquid fuels
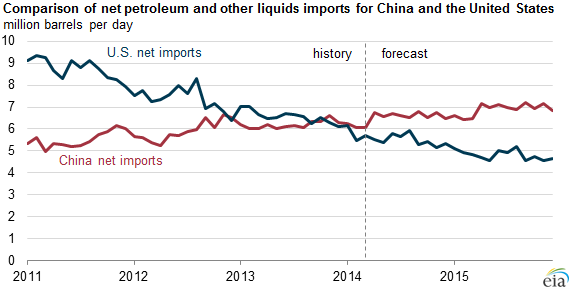
graph of net oil imports for China and U.S., as explained in the article text
Source: U.S. Energy Information Administration, Short-Term Energy Outlook, March 2014
Note: Net petroleum and other liquids imports are defined as total liquid fuels consumption minus domestic production.

In September 2013, China's net imports of petroleum and other liquids exceeded those of the United States on a monthly basis, making it the largest net importer of crude oil and other liquids in the world. The rise in China's net imports of petroleum and other liquids is driven by steady economic growth, with rapidly rising Chinese petroleum demand outpacing production growth.

U.S. total annual petroleum and other liquids production is expected to rise 31% between 2011 and 2014 to 13.3 million barrels per day, primarily from tight oil plays. In the meantime, Chinese production will increase at a much lower rate (5% over this period) and is forecast to be only a third of U.S. production in 2014.

On the demand side, China's liquid fuels use is expected to reach more than 11 million barrels per day in 2014, while U.S. demand hovers close to 18.9 million barrels per day, well below the peak U.S. consumption level of 20.8 million barrels per day in 2005. U.S. refined petroleum product exports increased by more than 173% between 2005 and 2013, lowering total net U.S. imports of petroleum and other liquids.

China has been diversifying the sources of its crude oil imports in recent years as a result of robust oil demand growth and recent geopolitical uncertainties. Saudi Arabia continues to be the largest supplier of crude oil to China and in 2013 provided 19% of China's 5.6 million barrels per day. Because production levels from Iran, Libya, and Sudan and South Sudan dropped since 2011, China replaced the lost shares of crude oil and other liquids imports from these countries with imports from Oman, Iraq, the United Arab Emirates, Angola, Venezuela, and Russia.

Principal contributor: Candace Dunn

Statistics
Analysis
Tools
Education
News

Petroleum & Other Liquids

Crude oil, gasoline, heating oil, diesel, propane, and other liquids including biofuels and natural gas liquids.

Natural Gas

Exploration and reserves, storage, imports and exports, production, prices, sales.

Electricity

Sales, revenue and prices, power plants, fuel use, stocks, generation, trade, demand & emissions.

Coal

Reserves, production, prices, employment and productivity, distribution, stocks, imports and exports.

Nuclear & Uranium

Uranium fuel, nuclear reactors, generation, spent fuel.

Renewable & Alternative Fuels

Includes hydropower, solar, wind, geothermal, biomass and ethanol.

EIA Survey Forms

Forms EIA uses to collect energy data including descriptions, links to survey instructions, and additional information.

Total Energy

Comprehensive data summaries, comparisons, analysis, and projections integrated across all energy sources.

U.S. States

State energy information, including overviews, rankings, data, and analyses.

International

International energy information, including overviews, rankings, data, and analyses.

Environment

Greenhouse gas data, voluntary reporting, electric power plant emissions.

Data Tools, Apps, & Maps

Tools to customize searches, view specific data sets, study detailed documentation, and access time-series data.

Open Data

EIA's free and open data available as API, Excel add-in, bulk files, and widgets

EIA Beta

Come test out some of the products still in development and let us know what you think!

Open Source Code

EIA's open source code, available on GitHub.

RSS Feeds

Subscribe to feeds for updates on EIA products including Today in Energy and What's New.