
Almost all U.S. coal production is consumed for electric power
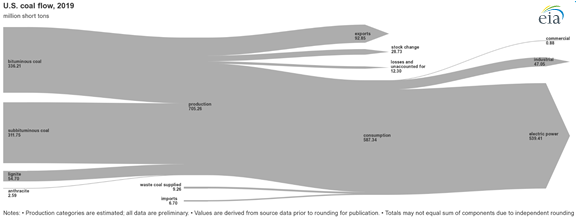
Note: Click to enlarge.
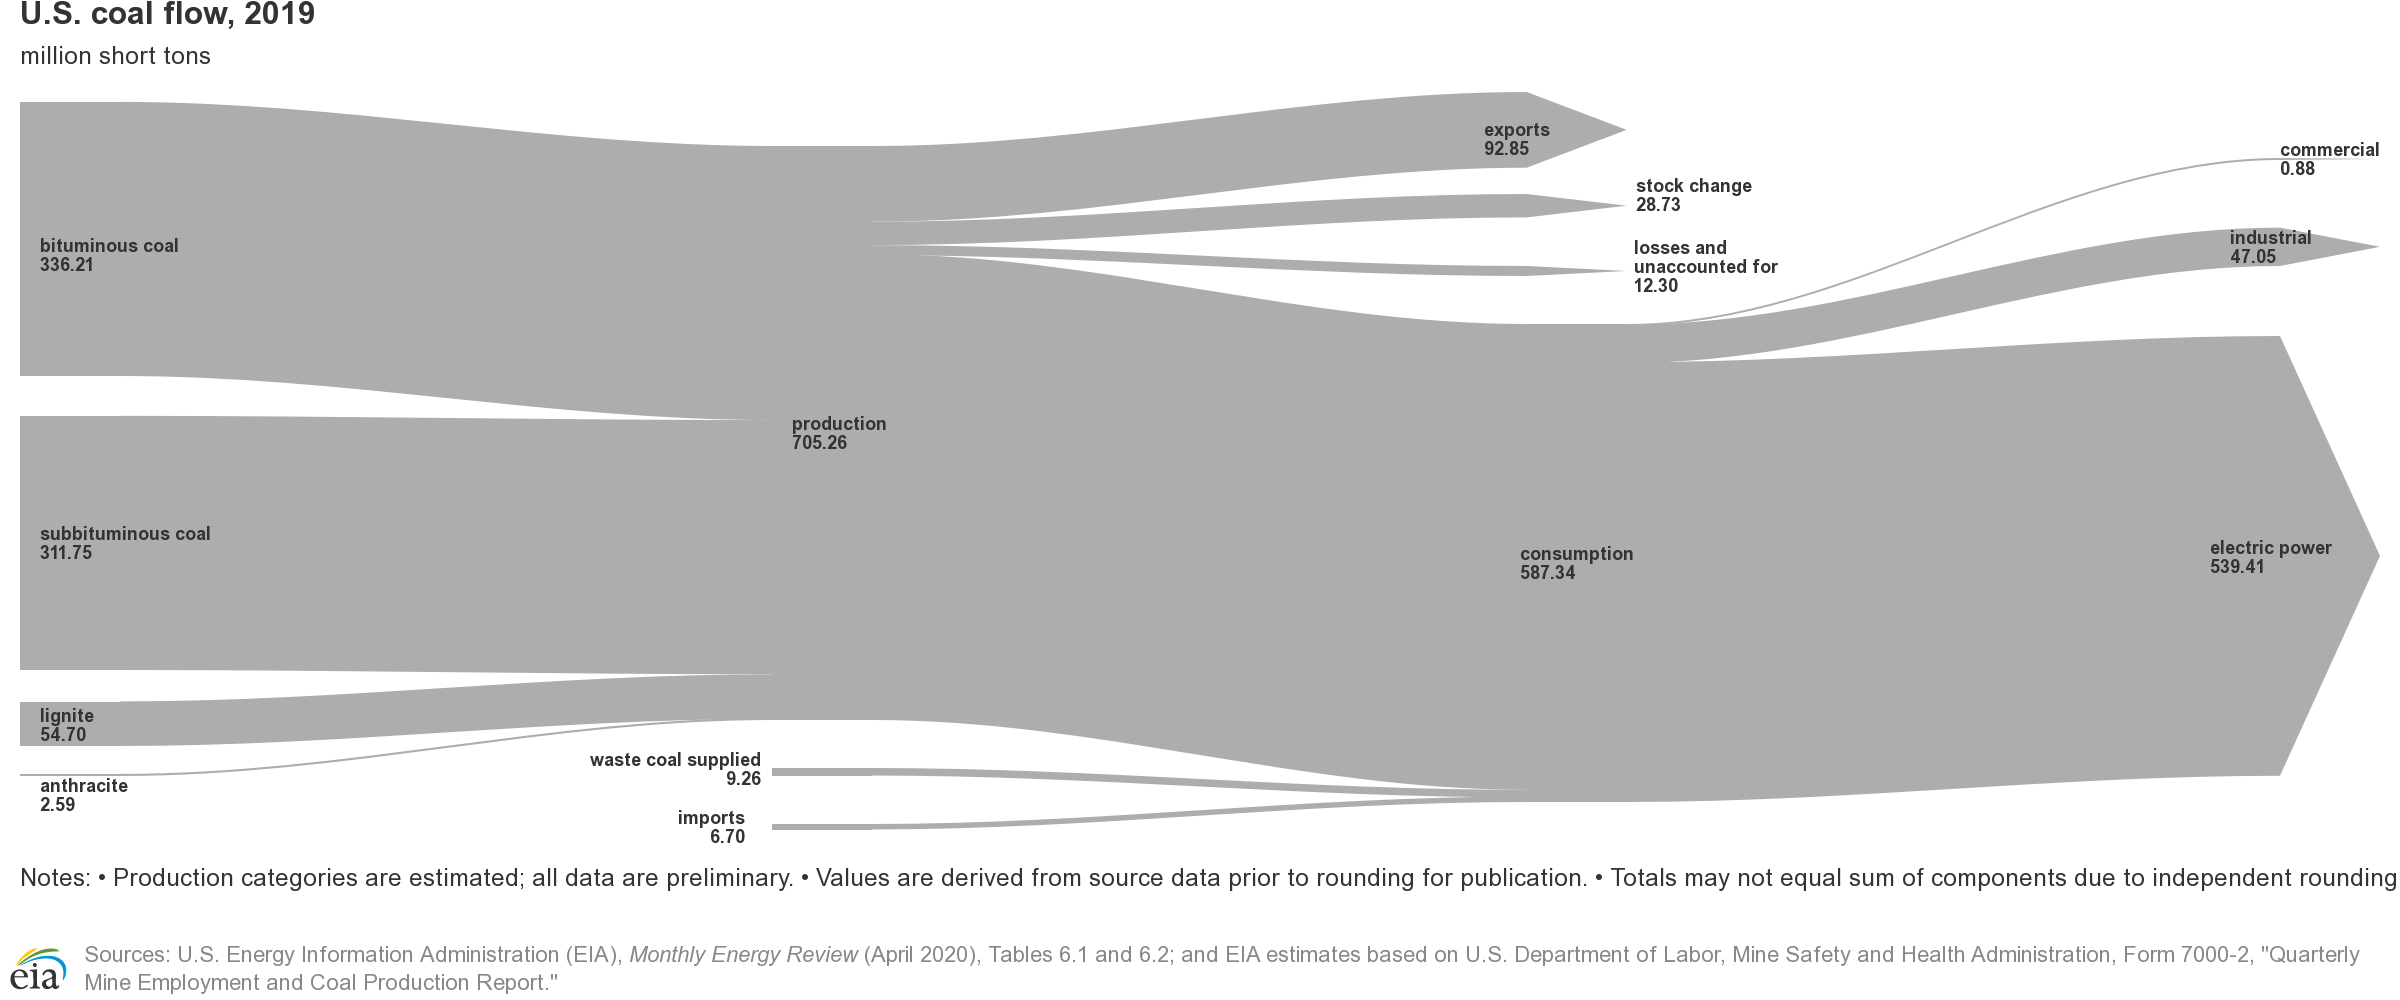
Coal is one of the main sources of energy in the United States, accounting for 14% of domestic primary energy production in 2019, according to the U.S. Energy Information Administration’s (EIA) Monthly Energy Review. Nearly all of the coal consumed in the United States is produced domestically. Most U.S. coal is consumed by the electric power sector to generate electricity, and some coal is exported. The U.S. coal flow diagram visualizes the flow of U.S. coal energy from supply (production and imports) to disposition (consumption, exports, stock withdrawals, and losses).
In 2019, the United States produced 705 million short tons (MMst) of coal, and the U.S. electric power sector consumed 539 MMst. The U.S. industrial sector and the commercial sector (which includes universities, correctional facilities, and hospitals) collectively consumed 48 MMst, and nearly twice that amount (93 MMst) was exported to other countries.
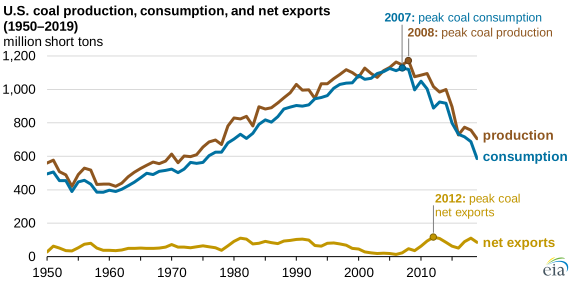
U.S. coal production and consumption have both declined since production peaked at 1,172 MMst in 2008 and consumption peaked at 1,128 MMst in 2007. In 2019, coal production reached 705 MMst, the lowest level since 1978, and coal consumption fell to 587 MMst, the lowest since 1975. Net exports of 85 MMst and a stockpile change of 29 MMst balanced U.S. coal demand with coal supply in 2019.
Coal is classified into different types, or ranks, largely based on the amount of carbon it contains and how much heat energy it produces when combusted. Most of the coal produced in the United States is bituminous or subbituminous. Bituminous coal, which accounted for an estimated 48% of total U.S. coal production in 2019, ranges from 45% to 86% carbon and is primarily produced in West Virginia, Illinois, Pennsylvania, Kentucky, and Indiana.
Subbituminous coal, which accounted for an estimated 44% of production in 2019, ranges from 35% to 45% carbon, has a lower heating value than bituminous coal, and is mostly produced in Wyoming. Smaller amounts of lower-energy lignite (25% to 35% carbon) and higher-energy anthracite (86% to 97% carbon) coal are also produced in the United States. Most U.S. production of lignite comes from North Dakota and Texas; all U.S. production of anthracite comes from Pennsylvania.
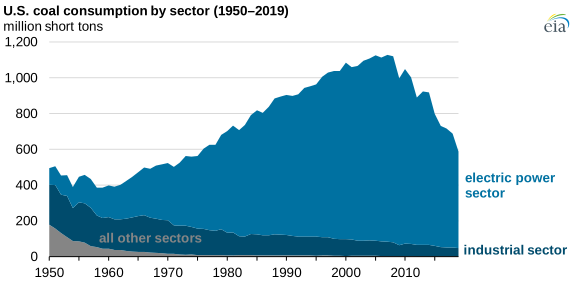
The electric power sector has been the largest consumer of coal in the United States since surpassing the industrial sector in 1961. The electric power sector used about 92% of coal consumed in the United States in 2019 to generate electricity and useful thermal output (heat). Most of the remaining U.S. coal is used directly by the industrial sector, such as in the industries that produce coal coke, concrete, paper, and steel.
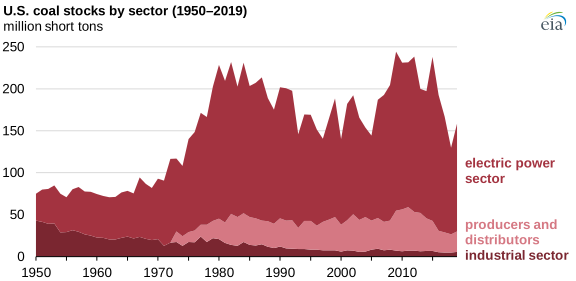
Note: Data for producers and distributors are not available prior to 1973.
Most coal stocks—81% in 2019—are held by the electric power sector. In 2019, producers and distributors held about 15% of total coal stocks, while the industrial sector held 4%.
U.S. coal production has typically exceeded consumption, and the United States has exported more coal than it imports since at least 1949, the earliest year of EIA’s coal trade data series. In 2019, U.S. exports of coal totaled 93 MMst, down 20% from 2018. The United States imported the equivalent of about 1% of its coal consumption in 2019.
Several EIA products include coal data:
- Coal data browser, an interactive data browser containing nearly all of EIA’s coal-related data series
- Quarterly and annual coal reports, which compile information from EIA’s coal industry surveys
- U.S. coal reserves, based on EIA’s annual EIA-7A survey
- Monthly Energy Review, EIA’s comprehensive source for historical energy data
Principal contributor: Allen McFarland
Tags: production/supply, generation, coal, electricity