U.S. Energy Information Administration logo
Skip to sub-navigation

Natural Gas

‹ See All Natural Gas Reports

U.S. Crude Oil and Natural Gas Proved Reserves, Year-end 2024

With Data for 2024   |  Release Date:  April 7, 2026   |   Next Release Date: April 2027

Previous Issues:

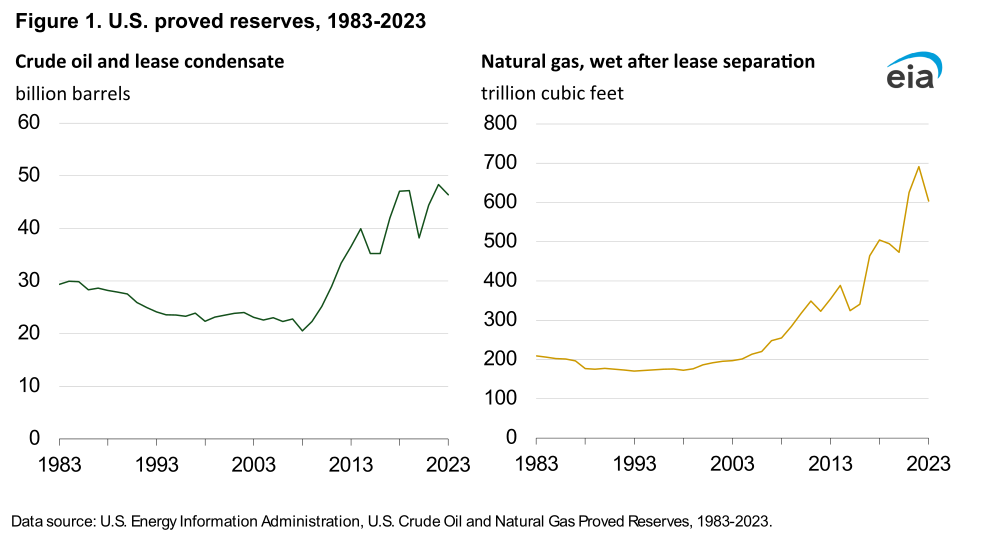
Figure 1. U.S. proved reserves, 1984–2024
figure data

In 2024, for the second consecutive year, average spot prices of both crude oil and natural gas in the United States decreased from recent highs in 2022. Proved reserves of crude oil and natural gas decreased 1% and 3%, respectively, compared with 2023.

Oil highlights 2024

  • U.S. crude oil and lease condensate proved reserves decreased 1% from 46.4 billion barrels to 46.0 billion barrels at year-end 2024.
  • U.S. crude oil and lease condensate production increased 2% in 2024.
  • Texas crude oil and lease condensate reserves decreased 3% in 2024, the largest annual net decline (529 million barrels) reported among all states. The second-largest net decline of oil reserves occurred in North Dakota (11%, or 487 million barrels).
  • The price of West Texas Intermediate (WTI) crude oil at Cushing, Oklahoma, decreased 1%, from $77.58 per barrel (b) in 2023 to $76.63/b in 2024.
  • New Mexico crude oil and lease condensate proved reserves increased 8%, the largest net increase (496 million barrels) in 2024.
  • Proved reserves from shale plays grew to 60% of U.S. crude oil and lease condensate proved reserves, after increasing 5% from 26.2 billion barrels at year-end 2023 to 27.5 billion barrels at year-end 2024.

Natural gas highlights 2024

  • Proved reserves of U.S. natural gas decreased 3%, from 603.6 trillion cubic feet (Tcf) at year-end 2023 to 583.9 Tcf at year-end 2024.
  • U.S. natural gas production increased 1% in 2024.
  • Texas natural gas proved reserves decreased 7% in 2024, the largest annual net decline (10.2 Tcf) among all states in 2024.
  • Louisiana had the second-largest net decline in proved reserves of natural gas in 2024 (26%, or 8.4 Tcf).
  • The price of natural gas at the Louisiana Henry Hub decreased 13% in 2024, from $2.53 per million British thermal units (MMBtu) in 2023 to $2.19/MMBtu in 2024, the lowest annual average price since 2020
  • Alaska reported the largest annual net increase in proved reserves of natural gas in 2024 (7%, or 6.4 Tcf).
  • U.S. natural gas proved reserves from shale plays were at their lowest level since 2021, declining 3% from 393.1 Tcf to 379.4 Tcf at year-end 2024. Even with this decline, natural gas reserves from shale plays account for 65% of U.S. natural gas proved reserves in 2024.

Proved reserves are estimated volumes of hydrocarbon resources that analysis of geologic and engineering data demonstrates with reasonable certainty are recoverable under existing economic and operating conditions. Reserves estimates change from year to year because of:

  • Price and cost changes
  • New discoveries
  • Thorough appraisals of existing fields
  • Existing reserves production
  • New and improved techniques and technologies

To prepare this report, we collect independently developed estimates of proved reserves with Form EIA-23L, Annual Report of Domestic Oil and Gas Proved Reserves, from a sample of U.S. operators of oil and natural gas fields. We use this sample to further estimate the portion of proved reserves from operators who do not report. This year, we received responses from 385 of 398 sampled operators, who provided coverage of about 95% of proved reserves of oil and 96% of proved reserves of natural gas at the national level. We develop estimates for reserves located in the United States by individual state and state subdivisions. States and regions with subdivisions are:

  • California
  • Louisiana
  • New Mexico
  • Texas
  • Federal Offshore

Contact: Petroleum and Other Liquids Data, eiainfopetroleum@eia.gov

Data tables

1. U.S. proved reserves, and reserves changes, 2023–24 PDF XLS
2. Crude oil and lease condensate production and proved reserves, from shale plays, 2023–24 PDF XLS
3. U.S. natural gas, wet after lease separation, reserves changes, by source, 2023–24 PDF XLS
4. Natural gas, wet after lease separation, production and proved reserves, from shale plays, 2023–24 PDF XLS
5. U.S. crude oil and lease condensate proved reserves, 2014–2024 PDF XLS
6. Crude oil and lease condensate proved reserves, reserves changes, by states and areas, 2024 PDF XLS
7. U.S. natural gas, wet after lease separation, proved reserves, 2014–24 PDF XLS
8. Natural gas, wet after lease separation, proved reserves, reserves changes, by states and areas, 2024 PDF XLS
9. Natural gas, wet after lease separation, proved reserves and production of shale plays, by states and areas, 2021–24 PDF XLS
10. Natural gas, wet after lease separation, proved reserves, reserves changes from shale plays, by states and areas, 2024 PDF XLS
11. Estimated natural gas plant liquids and dry natural gas content of natural gas, wet after lease separation, proved reserves, by states and areas, 2024 PDF XLS
12. Proved nonproducing reserves by states, areas, and shale plays, 2024 PDF XLS
Statistics
Analysis
Tools
Education
News

Petroleum & Other Liquids

Crude oil, gasoline, heating oil, diesel, propane, and other liquids including biofuels and natural gas liquids.

Natural Gas

Exploration and reserves, storage, imports and exports, production, prices, sales.

Electricity

Sales, revenue and prices, power plants, fuel use, stocks, generation, trade, demand & emissions.

Coal

Reserves, production, prices, employment and productivity, distribution, stocks, imports and exports.

Nuclear & Uranium

Uranium fuel, nuclear reactors, generation, spent fuel.

Renewable & Alternative Fuels

Includes hydropower, solar, wind, geothermal, biomass and ethanol.

EIA Survey Forms

Forms EIA uses to collect energy data including descriptions, links to survey instructions, and additional information.

Total Energy

Comprehensive data summaries, comparisons, analysis, and projections integrated across all energy sources.

U.S. States

State energy information, including overviews, rankings, data, and analyses.

International

International energy information, including overviews, rankings, data, and analyses.

Environment

Greenhouse gas data, voluntary reporting, electric power plant emissions.

Data Tools, Apps, & Maps

Tools to customize searches, view specific data sets, study detailed documentation, and access time-series data.

Open Data

EIA's free and open data available as API, Excel add-in, bulk files, and widgets

EIA Beta

Come test out some of the products still in development and let us know what you think!

Open Source Code

EIA's open source code, available on GitHub.

RSS Feeds

Subscribe to feeds for updates on EIA products including Today in Energy and What's New.