
1997 RECS Survey Data 2024 | 2020 | 2015 |2009 | 2005 | 2001 | 1997 | 1993 | Previous
- Housing characteristics
- Consumption & expenditures
- Microdata
- Methodology
Consumption & Expenditures Tables
| Table Titles | Consumption | Expenditures |
|---|---|---|
| Tables: CE1 Total Energy Consumption in U.S. Households | ||
| Tables: CE2 Space Heating in U.S. Households | ||
| NOTE: As of 5/5/00, the "heated square footage" and "intensities" numbers were revised and will differ from the numbers in the published report. | ||
| Tables: CE3 Air Conditioning in U.S. Households | ||
| Tables: CE4 Water Heating in U.S. Households | ||
| Tables: CE5 Appliances, in U.S. Households | ||
| Fuel Tables | Consumption |
|---|---|
| Table 1. Natural Gas Consumption and Expenditures in U.S. Households by End Uses and Census Region | |
| Table 2. Fuel Oil Consumption and Expenditures in U.S. Households by End Uses and Census Region | |
| Table 3. Electricity Consumption and Expenditures in U.S. Households by End Uses and Census Region | |
| Table 4. LPG Consumption and Expenditures in U.S. Households by End Uses and Census Region | |
| Table 5. Kerosene Consumption and Expenditures in U.S. Households by End Uses and Census Region |
Household Energy Usage
The 1997 Residential Energy Consumption Survey (RECS) collected household energy data for the four most populated States: California, Florida, New York, and Texas. Data for all the other States are aggregated and available at the Census Division (groups of 3 to 8 States) level.
For an overview of the energy-related characteristics and usage in each of the four most populated States, click on the State (in the left column).
For detailed data, choose from the tables listed below. Each table presents the pertinent information for each of the four States. All these data are from the 1997 RECS and are the most recent end-user household data.
Energy End Usage: The suppliers of electricity, natural gas, fuel oil, and propane to the 5,000 households are then asked to provide the amount and cost of fuels delivered to the household. Through a statistical regression procedure, the total usage and costs of energy are allocated among four energy end uses: space heating, air conditioning, water heating, and appliances.
| Energy End-Use Tables for the Four Most Populated States (CA, FL, NY, and TX) |
Characteristics
(Million U.S. Households) |
Percentages
(Percent of U.S. Households) |
|---|---|---|
| Table CE1 - Total Energy Consumption in U.S. Households (Includes: number of households and fuels used, all households and per household consumption in both Btu and physical units.) |
||
| Table CE2 - Space-Heating Energy Consumption in U.S. Households (Includes: number of households and fuels used, all households and average per household Btu consumption, and heated square footage by fuel.) |
||
| Table CE3 - Electric Air-Conditioning (AC) Energy Consumption in U.S. Households (Includes: number of households using AC, all households and average per household AC consumption (in Btu and KWh), cooled square footage and cooling degree-days.) |
||
| Table CE4 - Water-Heating Energy Consumption in U.S. Households (Includes: number of households with water heating, fuels used, all households and average per household water-heating consumption.) |
||
| Table CE5 - Appliances Energy Consumption in U.S. Households (Includes: number of households with appliances; all households and average per household appliances consumption in Btu and physical units, and appliances fuel used.) |
Median Values and Percentiles for Household Energy Data
The 1997 RECS detailed tables contain estimates of mean annual energy consumption for households. The amount of energy consumed by households varies widely–a useful way to describe the variation is with tables and graphs of percentiles of consumption. For each of the household characteristics categories below are tables and graphs of percentiles of consumption (5th, 10th, 25th, median, 75th, 90th, and 95th percentiles), and tables and graphs of mean values of consumption, standard errors, and 95% confidence ranges.
Electricity Consumption per Household
Natural Gas Consumption per Household
All Households
| 5th percentile | 10th percentile | 25th percentile | median | 75th percentile | 90th percentile | 95th percentile | |
|---|---|---|---|---|---|---|---|
| All Households | 2,287 | 3,167 | 5,056 | 8,370 | 13,485 | 19,866 | 24,436 |
Notes: The data in this table are for households that used electricity. The percentiles describe the distribution of household electricity consumption data; for example, 25% of households consumed less than 5,056 kWh and 75% consumed more than that amount. |
|||||||
Figure 1. Annual Electricity Consumption Percentiles, 1997
(thousand kilowatthours per household)
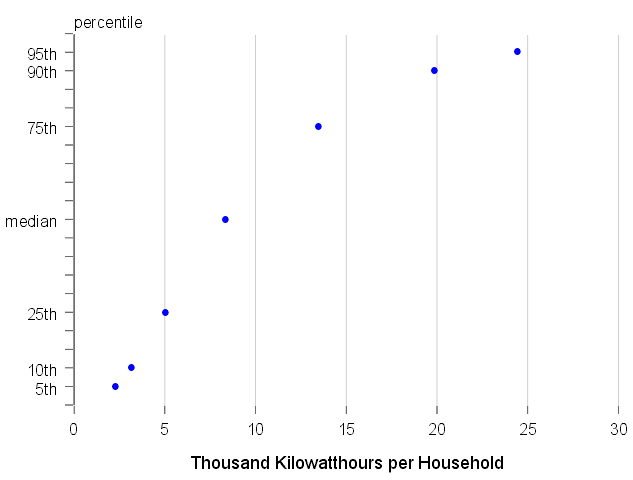
Notes: The data in this graph are for households that used electricity.
The percentiles describe the distribution of household electricity consumption data; for example, 25% of households consumed less than 5,056 kWh and 75% consumed more than that amount.
| Electricity Consumption per Household (kWh) | Relative Standard Error (percent) | Standard Error (kWh) | 95% confidence level lower bound (kWh) | 95% confidence level upper bound (kWh) | |
|---|---|---|---|---|---|
| All Households |
10,219 | 1.4 | 430 | 9,939 | 10,499 |
| Notes: The data in this table are for households that used electricity. The standard error is a measure of sampling error and can be used to calculate a confidence range. For example, the estimate for electricity consumption is 10,219 kWh and the standard error is 430 kWh. The 95% confidence interval is calculated by multiplying 1.96 times the standard error, and the 95% confidence range is 9,939 kWh to 10,499 kWh. | |||||
Census Division
| 5th percentile | 10th percentile | 25th percentile | median | 75th percentile | 90th percentile | 95th percentile | |
|---|---|---|---|---|---|---|---|
| All Households | 2,287 | 3,167 | 5,056 | 8,370 | 13,485 | 19,866 | 24,436 |
| Census Division | |||||||
| New England | 1,911 | 2,470 | 3,580 | 5,739 | 8,723 | 12,473 | 16,609 |
| Middle Atlantic | 1,682 | 2,287 | 3,573 | 5,608 | 9,653 | 14,344 | 19,137 |
| East North Central | 2,311 | 3,252 | 4,705 | 7,378 | 10,749 | 15,390 | 18,789 |
| West North Central | 2,765 | 3,413 | 5,425 | 8,385 | 12,700 | 18,116 | 25,168 |
| South Atlantic | 3,745 | 5,227 | 7,800 | 11,861 | 17,440 | 22,418 | 25,509 |
| East South Central | 3,978 | 5,706 | 8,941 | 13,286 | 19,545 | 26,914 | 30,900 |
| West South Central | 3,704 | 5,065 | 7,939 | 12,220 | 17,477 | 25,927 | 29,632 |
| Mountain | 2,756 | 3,336 | 5,301 | 7,976 | 12,161 | 17,944 | 21,154 |
| Pacific | 1,778 | 2,345 | 3,831 | 6,333 | 10,440 | 16,839 | 20,821 |
Notes: The data in this table are for households that used electricity. The percentiles describe the distribution of household electricity consumption data; for example, 25% of households in New England consumed less than 3,580 kWh and 75% consumed more than that amount. |
|||||||
Figure 1. Annual Electricity Consumption Percentiles by Census Division, 1997
(thousand kilowatthours per household)
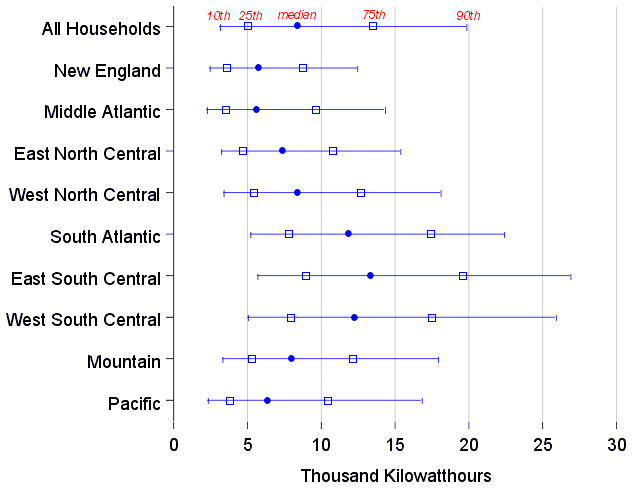
Notes: The data in this graph are for households that used electricity.
The percentiles describe the distribution of household electricity consumption data; for example, 25% of households in New England consumed less than 3,580 kWh and 75% consumed more than that amount.
| Electricity Consumption per Household (kWh) | Relative Standard Error (percent) | Standard Error (kWh) | 95% confidence level lower bound (kWh) | 95% confidence level upper bound (kWh) | |
|---|---|---|---|---|---|
| All Households | 10,219 | 1.4 | 430 | 9,939 | 10,499 |
| Census Division | |||||
| New England | 7,062 | 5.5 | 388 | 6,301 | 7,824 |
| Middle Atlantic | 7,313 | 4.4 | 322 | 6,682 | 7,944 |
| East North Central | 8,631 | 5.0 | 432 | 7,785 | 9,476 |
| West North Central | 10,181 | 6.6 | 672 | 8,864 | 11,498 |
| South Atlantic | 13,077 | 2.9 | 379 | 12,334 | 13,820 |
| East South Central | 14,890 | 6.4 | 953 | 13,023 | 16,758 |
| West South Central | 13,826 | 4.5 | 622 | 12,606 | 15,045 |
| Mountain | 9,424 | 4.5 | 424 | 8,593 | 10,256 |
| Pacific | 8,203 | 2.9 | 238 | 7,737 | 8,669 |
Notes: The data in this table are for households that used electricity. The standard error is a measure of sampling error and can be used to calculate a confidence range. For example, the estimate for electricity consumption for New England is 7,062 kWh and the standard error is 388 kWh. The 95% confidence interval is calculated by multiplying 1.96 times the standard error, and the 95% confidence range is 6,301kWh to 7,824 kWh. |
|||||
Figure 2. Mean Annual Electricity Consumption (and 95% confidence ranges) by Census Division, 1997
(thousand kilowatthours per household)
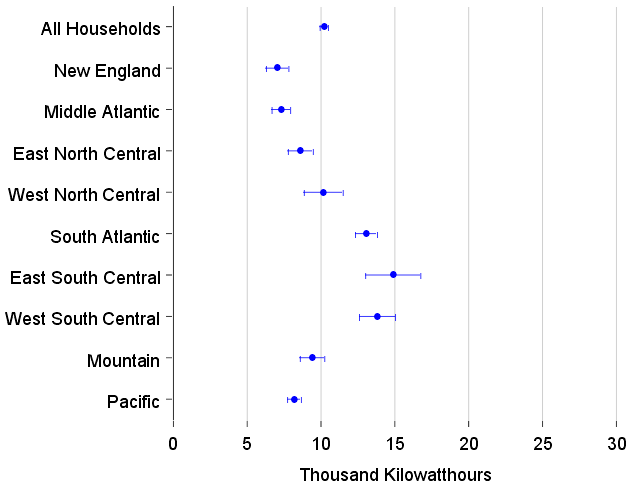
Notes: The data in this graph are for households that used electricity.
The standard error is a measure of sampling error and can be used to calculate a confidence range. For example, the estimate for electricity consumption for New England is 7,062 kWh and the standard error is 388 kWh. The 95% confidence interval is calculated by multiplying 1.96 times the standard error, and the 95% confidence range is 6,301kWh to 7,824 kWh.
Years Constructed
| 5th percentile | 10th percentile | 25th percentile | median | 75th percentile | 90th percentile | 95th percentile | |
|---|---|---|---|---|---|---|---|
| All Households | 2,287 | 3,167 | 5,056 | 8,370 | 13,485 | 19,866 | 24,436 |
| Year Constructed | |||||||
| Before 1940 | 1,778 | 2,369 | 3,867 | 6,363 | 10,256 | 14,369 | 18,355 |
| 1940 to 1949 | 1,778 | 2,212 | 3,574 | 5,940 | 9,660 | 14,945 | 19,452 |
| 1950 to 1959 | 2,345 | 3,070 | 4,651 | 7,556 | 11,234 | 17,193 | 22,229 |
| 1960 to 1969 | 2,374 | 3,172 | 4,912 | 7,969 | 12,032 | 18,267 | 21,976 |
| 1970 to 1979 | 2,311 | 3,336 | 5,925 | 10,039 | 15,976 | 23,422 | 27,933 |
| 1980 to 1989 | 3,723 | 4,738 | 7,156 | 10,950 | 16,555 | 22,312 | 26,137 |
| 1990 to 1997 | 3,518 | 4,283 | 7,281 | 10,815 | 16,860 | 21,812 | 24,893 |
Notes: The data in this table are for households that used electricity. The percentiles describe the distribution of household electricity consumption data; for example, 25% of households in units constructed before 1940 consumed less than 3,867 kWh and 75% consumed more than that amount. |
|||||||
Figure 1. Annual Electricity Consumption Percentiles by Year Constructed, 1997
(thousand kilowatthours per household)
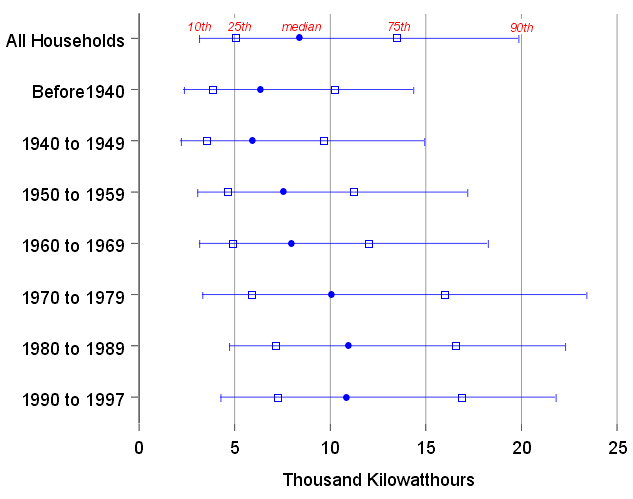
Notes: The data in this graph are for households that used electricity. The percentiles describe the distribution of household electricity consumption data; for example, 25% of households in units constructed before 1940 consumed less than 3,867 kWh and 75% consumed more than that amount.
| Electricity Consumption per Household (kWh) |
Relative Standard Error (percent) | Standard Error (kWh) | 95% confidence level lower bound (kWh) | 95% confidence level upper bound (kWh) | |
|---|---|---|---|---|---|
| All Households | 10,219 | 1.4 | 430 | 9,939 | 10,499 |
| Year Constructed | |||||
| Before 1940 | 7,781 | 2.6 | 202 | 7,384 | 8,177 |
| 1940 to 1949 | 7,641 | 4.8 | 367 | 6,922 | 8,359 |
| 1950 to 1959 | 9,033 | 3.0 | 271 | 8,502 | 9,564 |
| 1960 to 1969 | 9,459 | 3.1 | 293 | 8,884 | 10,034 |
| 1970 to 1979 | 11,976 | 2.9 | 347 | 11,295 | 12,657 |
| 1980 to 1989 | 12,449 | 2.6 | 324 | 11,814 | 13,083 |
| 1990 to 1997 | 12,512 | 4.4 | 551 | 11,433 | 13,591 |
Notes: The data in this table are for households that used electricity. The standard error is a measure of sampling error and can be used to calculate a confidence range. For example, the estimate for electricity consumption in units constructed before 1940 is 7,781 kilowatthours (kWh) and the standard error is 202 kWh. The 95% confidence interval is calculated by multiplying 1.96 times the standard error, and the 95% confidence range is 7,384 kWh to 8,177 kWh. |
|||||
Figure 2. Mean Annual Electricity Consumption (and 95% confidence ranges) by Year Constructed, 1997
(thousand kilowatthours per household)

Notes: The data in this graph are for households that used electricity.
The standard error is a measure of sampling error and can be used to calculate a confidence range. For example, the estimate for electricity consumption in units constructed before 1940 is 7,781 kilowatthours (kWh) and the standard error is 202 kWh. The 95% confidence interval is calculated by multiplying 1.96 times the standard error, and the 95% confidence range is 7,384 kWh to 8,177 kWh.
Type of Housing Unit
| 5th percentile | 10th percentile | 25th percentile | median | 75th percentile | 90th percentile | 95th percentile | |
|---|---|---|---|---|---|---|---|
| All Households | 2,287 | 3,167 | 5,056 | 8,370 | 13,485 | 19,866 | 24,436 |
| Type of Housing Unit |
|||||||
| Mobile Home | 3,236 | 3,994 | 6,059 | 10,227 | 16,228 | 21,815 | 24,836 |
| Single-Family, Detached |
3,408 | 4,310 | 6,414 | 9,942 | 15,120 | 21,812 | 26,900 |
| Single-Family, Attached |
2,149 | 2,841 | 3,993 | 6,542 | 10,501 | 16,726 | 19,533 |
| Multifamily, 2 to 4 Units |
1,487 | 1,839 | 3,071 | 4,988 | 8,615 | 12,938 | 16,602 |
| Multifamily, 5 or More Units |
1,579 | 1,903 | 2,864 | 4,713 | 7,777 | 12,069 | 14,733 |
Notes: The data in this table are for households that used electricity. The percentiles describe the distribution of household electricity consumption data; for example, 25% of households living in mobile homes consumed less than 6,059 kWh and 75% consumed more than that amount. |
|||||||
Figure 1. Annual Electricity Consumption Percentiles by Type of Housing Unit, 1997
(thousand kilowatthours per household)
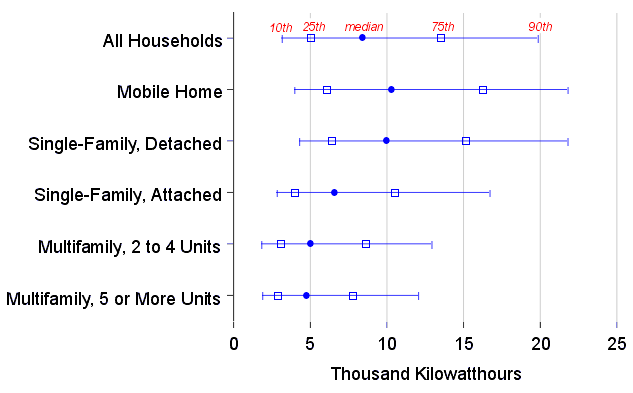
Notes: The data in this graph are for households that used electricity.
The percentiles describe the distribution of household electricity consumption data; for example, 25% of households living in mobile homes consumed less than 6059 kWh and 75% consumed more than that amount.
| Electricity Consumption per Household (kWh) | Relative Standard Error (percent) | Standard Error (kWh) | 95% confidence level lower bound (kWh) | 95% confidence level upper bound (kWh) | |
|---|---|---|---|---|---|
| All Households | 10,219 | 1.4 | 430 | 9,939 | 10,499 |
| Type of Housing Unit | |||||
| Mobile Home | 11,739 | 4.0 | 470 | 10,818 | 12,659 |
| Single-Family, Detached |
11,778 | 1.6 | 188 | 11,409 | 12,147 |
| Single-Family, Attached |
8,071 | 3.9 | 315 | 7,454 | 8,688 |
| Multifamily, 2 to 4 Units |
6,505 | 5.3 | 345 | 5,829 | 7,181 |
| Multifamily, 5 or More Units |
5,990 | 4.2 | 252 | 5,497 | 6,483 |
Notes: The data in this table are for households that used electricity. The standard error is a measure of sampling error and can be used to calculate a confidence range. For example, the estimate for electricity consumption for mobile homes is 11,739 kWh and the standard error is 470 kWh. The 95% confidence interval is calculated by multiplying 1.96 times the standard error, and the 95% confidence range is 10,818 kWh to 12,659 kWh. |
|||||
Figure 2. Mean Annual Electricity Consumption (and 95% confidence ranges) by Type of Housing Unit, 1997
(thousand kilowatthours per household)
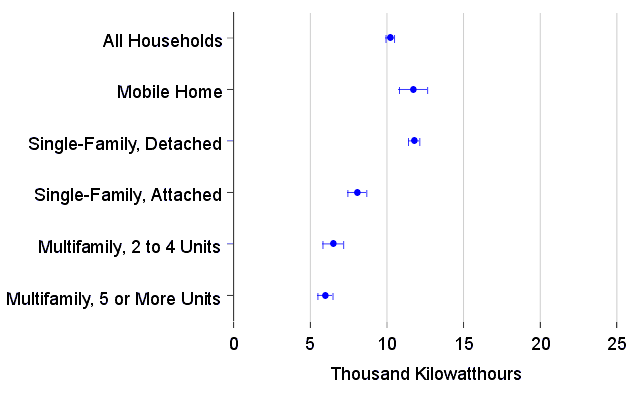
Notes: The data in this graph are for households that used electricity.
The standard error is a measure of sampling error and can be used to calculate a confidence range. For example, the estimate for electricity consumption for mobile homes is 11,739 kWh and the standard error is 470 kWh. The 95% confidence interval is calculated by multiplying 1.96 times the standard error, and the 95% confidence range is 10,818 kWh to 12,659 kWh.
Household Income
| 5th percentile | 10th percentile | 25th percentile | median | 75th percentile | 90th percentile | 95th percentile | |
|---|---|---|---|---|---|---|---|
| All Households | 2,287 | 3,167 | 5,056 | 8,370 | 13,485 | 19,866 | 24,436 |
| Household Income | |||||||
| Less than 10,000 Dollars | 1,577 | 2,033 | 3,297 | 5,704 | 9,432 | 14,994 | 19,537 |
| 10,000 to 14,999 Dollars | 1,778 | 2,250 | 3,798 | 6,313 | 10,249 | 15,780 | 20,878 |
| 15,000 to 19,999 Dollars | 2,125 | 2,965 | 4,452 | 7,688 | 12,313 | 17,148 | 20,451 |
| 20,000 to 24,999 Dollars | 2,324 | 3,311 | 4,823 | 8,065 | 12,706 | 18,881 | 23,032 |
| 25,000 to 34,999 Dollars | 2,774 | 3,358 | 5,210 | 7,922 | 12,534 | 17,845 | 21,853 |
| 35,000 to 49,999 Dollars | 2,916 | 3,843 | 5,569 | 9,166 | 13,770 | 19,943 | 24,532 |
| 50,000 to 74,999 Dollars | 3,126 | 4,360 | 6,852 | 10,589 | 16,335 | 22,406 | 26,571 |
| More than 75,000 Dollars | 4,047 | 5,000 | 7,777 | 11,814 | 18,044 | 26,207 | 30,556 |
Notes: The data in this table are for households that used electricity. The percentiles describe the distribution of household electricity consumption data; for example, 25% of households with incomes less than 10,000 dollars consumed less than 3,297 kilowatthours (kWh) and 75% consumed more than that amount. |
|||||||
Figure 1. Annual Electricity Consumption Percentiles by Household Income, 1997
(thousand kilowatthours per household)
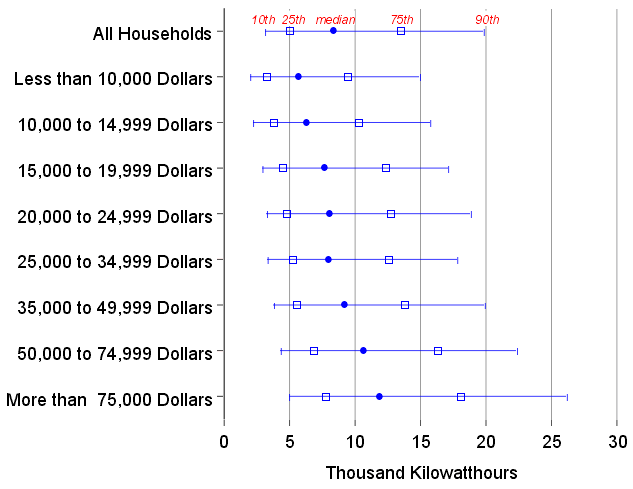
Notes: The data in this graph are for households that used electricity.
The percentiles describe the distribution of household electricity consumption data; for example, 25% of households with incomes less than 10,000 dollars consumed less than 3,297 kilowatthours (kWh) and 75% consumed more than that amount.
| Electricity Consumption per Household (kWh) |
Relative Standard Error (percent) | Standard Error (kWh) | 95% confidence level lower bound (kWh) | 95% confidence level upper bound (kWh) | |
|---|---|---|---|---|---|
| All Households | 10,219 | 1.4 | 430 | 9,939 | 10,499 |
| Household Income | |||||
| Less than 10,000 Dollars | 7,372 | 4.8 | 354 | 6,678 | 8,065 |
| 10,000 to 14,999 Dollars | 7,975 | 3.8 | 303 | 7,381 | 8,568 |
| 15,000 to 19,999 Dollars | 9,031 | 3.4 | 307 | 8,429 | 9,633 |
| 20,000 to 24,999 Dollars | 9,963 | 4.6 | 458 | 9,065 | 10,862 |
| 25,000 to 34,999 Dollars | 9,652 | 2.3 | 222 | 9,217 | 10,087 |
| 35,000 to 49,999 Dollars | 10,697 | 2.5 | 267 | 10,173 | 11,221 |
| 50,000 to 74,999 Dollars | 12,265 | 2.8 | 343 | 11,592 | 12,938 |
| More than 75,000 Dollars | 13,988 | 2.8 | 392 | 13,220 | 14,755 |
Notes: The data in this table are for households that used electricity. The standard error is a measure of sampling error and can be used to calculate a confidence range. For example, the estimate for electricity consumption for households with incomes less than 10,000 dollars is 7,372 kilowatthours (kWh) and the standard error is 354 kWh. The 95% confidence interval is calculated by multiplying 1.96 times the standard error, and the 95% confidence range is 6,678 kWh to 8,065 kWh. |
|||||
Figure 2. Mean Annual Electricity Consumption (and 95% confidence ranges) by Household Income, 1997
(thousand kilowatthours per household)
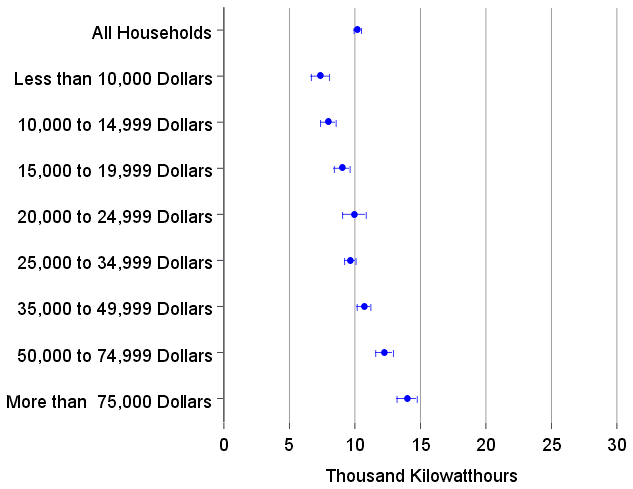
Notes: The data in this graph are for households that used electricity. The standard error is a measure of sampling error and can be used to calculate a confidence range. For example, the estimate for electricity consumption for households with incomes less than 10,000 dollars is 7,372 kilowatthours (kWh) and the standard error is 354 kWh. The 95% confidence interval is calculated by multiplying 1.96 times the standard error, and the 95% confidence range is 6,678 kWh to 8,065 kWh.
| 5th percentile | 10th percentile | 25th percentile | median | 75th percentile | 90th percentile | 95th percentile | |
|---|---|---|---|---|---|---|---|
| All Households |
12 | 22 | 43 | 74 | 113 | 154 | 188 |
Notes: The data in this table are for households that used natural gas. The percentiles describe the distribution of household natural gas consumption data; for example, 25% of households consumed less than 43 thousand cubic feet and 75% consumed more than that amount. |
|||||||
Figure 1. Annual Natural Gas Consumption Percentiles, 1997
(thousand cubic feet per household)
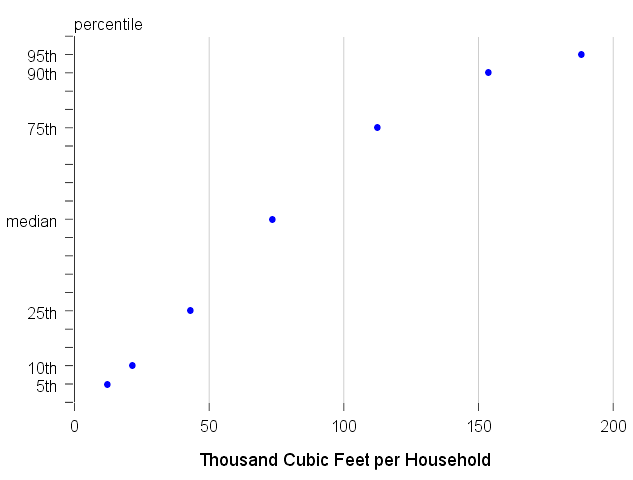
Notes: The data in this graph are for households that used natural gas.
The percentiles describe the distribution of household natural gas consumption data; for example, 25% of households consumed less than 43 thousand cubic feet and 75% consumed more than that amount.
| Natural Gas Consumption per Household (1,000 cf) |
Relative Standard Error (percent) | Standard Error (1,000 cf) |
95% confidence level lower bound (1,000 cf) | 95% confidence level upper bound (1,000 cf) | |
|---|---|---|---|---|---|
| All Households |
83 | 1.8 | 1 | 80 | 86 |
| Notes: The data in this table are for households that used natural gas. The standard error is a measure of sampling error and can be used to calculate a confidence range. For example, the estimate for natural gas consumption for households is 83 thousand cubic feet (cf) and the standard error is 1 thousand cf. The 95% confidence interval is calculated by multiplying 1.96 times the standard error, and the 95% confidence range is 80 thousand cf to 86 thousand cf. |
|||||
Census Division
| 5th percentile | 10th percentile | 25th percentile | median | 75th percentile | 90th percentile | 95th percentile | |
|---|---|---|---|---|---|---|---|
| All Households | 12 | 22 | 43 | 74 | 113 | 154 | 188 |
| Census Division | |||||||
| New England | 4 | 8 | 41 | 83 | 123 | 151 | 166 |
| Middle Atlantic | 3 | 5 | 40 | 80 | 119 | 161 | 190 |
| East North Central | 38 | 58 | 79 | 114 | 149 | 194 | 218 |
| West North Central | 32 | 51 | 72 | 97 | 128 | 165 | 213 |
| South Atlantic | 13 | 19 | 33 | 57 | 87 | 109 | 146 |
| East South Central | 13 | 22 | 39 | 56 | 86 | 123 | 152 |
| West South Central | 20 | 27 | 43 | 61 | 88 | 114 | 135 |
| Mountain | 17 | 22 | 43 | 70 | 103 | 133 | 160 |
| Pacific | 14 | 20 | 28 | 47 | 66 | 89 | 113 |
Notes: The data in this table are for households that used natural gas. The percentiles describe the distribution of household natural gas consumption data; for example, 25% of households in New England consumed less than 41 thousand cubic feet and 75% consumed more than that amount. |
|||||||
Figure 1. Annual Natural Gas Consumption Percentiles by Census Division, 1997
(thousand cubic feet per household)
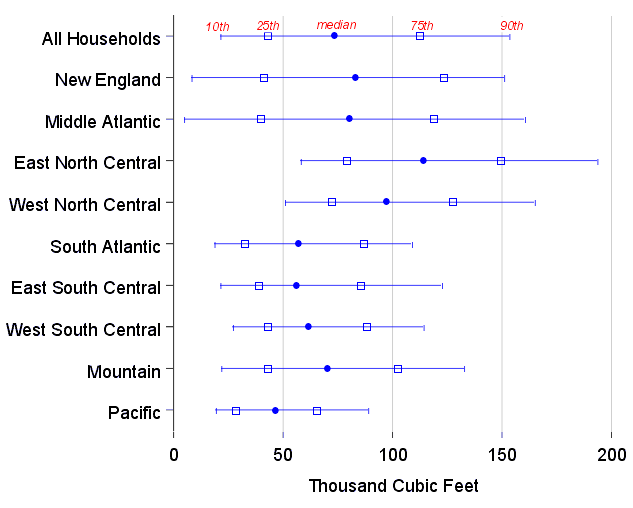
Notes: The data in this graph are for households that used natural gas.
The percentiles describe the distribution of household natural gas consumption data; for example, 25% of households in New England consumed less than 41 thousand cubic feet and 75% consumed more than that amount.
| Natural Gas Consumption per Household (1,000 cf) |
Relative Standard Error (percent) | Standard Error (1,000 cf) |
95% confidence level lower bound (1,000 cf) | 95% confidence level upper bound (1,000 cf) | |
|---|---|---|---|---|---|
| All Households | 83 | 1.8 | 1 | 80 | 86 |
| Census Division | |||||
| New England | 85 | 5.3 | 4 | 76 | 94 |
| Middle Atlantic | 85 | 4.2 | 4 | 78 | 92 |
| East North Central | 119 | 1.4 | 2 | 116 | 123 |
| West North Central | 104 | 6.7 | 7 | 91 | 118 |
| South Atlantic | 65 | 8.9 | 6 | 53 | 76 |
| East South Central | 67 | 8.7 | 6 | 56 | 79 |
| West South Central | 68 | 8.6 | 6 | 57 | 80 |
| Mountain | 77 | 6.6 | 5 | 67 | 87 |
| Pacific | 53 | 4.5 | 2 | 48 | 57 |
Notes: The data in this table are for households that used natural gas. The standard error is a measure of sampling error and can be used to calculate a confidence range. For example, the estimate for natural gas consumption for households in New England is 85 thousand cubic feet (cf) and the standard error is 4 thousand cf. The 95% confidence interval is calculated by multiplying 1.96 times the standard error, and the 95% confidence range is 76 thousand cf to 94 thousand cf. |
|||||
Figure 2. Mean Annual Natural Gas Consumption (and 95% confidence ranges) by Census Division, 1997
(thousand cubic feet per household)
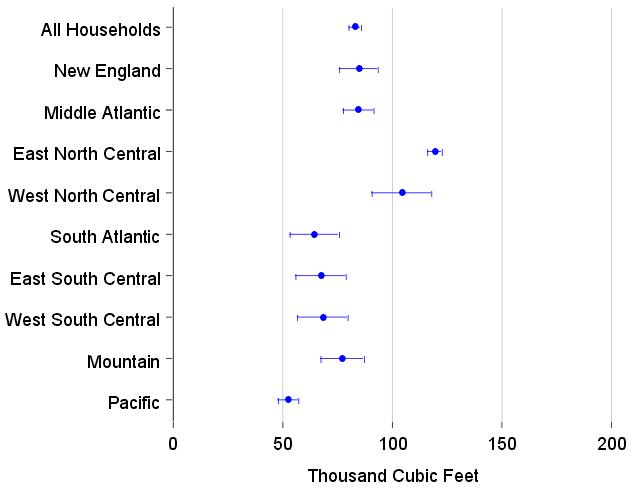
Notes: The data in this graph are for households that used natural gas.
The standard error is a measure of sampling error and can be used to calculate a confidence range. For example, the estimate for natural gas consumption for households in New England is 85 thousand cubic feet (cf) and the standard error is 4 thousand cf. The 95% confidence interval is calculated by multiplying 1.96 times the standard error, and the 95% confidence range is 76 thousand cf to 94 thousand cf.
Year Constructed
| 5th percentile | 10th percentile | 25th percentile | median | 75th percentile | 90th percentile | 95th percentile | |
|---|---|---|---|---|---|---|---|
| All Households | 12 | 22 | 43 | 74 | 113 | 154 | 188 |
| Year Constructed | |||||||
| Before 1940 | 5 | 18 | 51 | 97 | 141 | 193 | 217 |
| 1940 to 1949 | 12 | 23 | 43 | 72 | 112 | 154 | 176 |
| 1950 to 1959 | 15 | 26 | 49 | 76 | 111 | 142 | 161 |
| 1960 to 1969 | 14 | 20 | 37 | 66 | 97 | 140 | 174 |
| 1970 to 1979 | 12 | 20 | 38 | 69 | 103 | 139 | 164 |
| 1980 to 1989 | 16 | 24 | 46 | 67 | 96 | 120 | 136 |
| 1990 to 1997 | 18 | 27 | 41 | 68 | 104 | 145 | 199 |
Notes: The data in this table are for households that used natural gas. The percentiles describe the distribution of household natural gas consumption data; for example, 25% of households in units constructed before 1940 consumed less than 51 thousand cubic feet and 75% consumed more than that amount. |
|||||||
Figure 1. Annual Natural Gas Consumption Percentiles by Year Constructed, 1997
(thousand cubic feet per household)
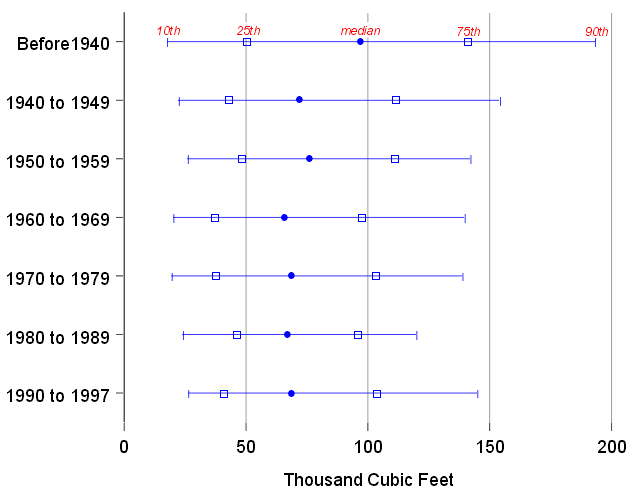
Notes: The data in this graph are for households that used natural gas.
The percentiles describe the distribution of household natural gas consumption data; for example, 25% of households in units constructed before 1940 consumed less than 51 thousand cubic feet and 75% consumed more than that amount.
| Natural Gas Consumption per Household (1,000 cf) |
Relative Standard Error (percent) | Standard Error (1,000 cf) |
95% confidence level lower bound (1,000 cf) | 95% confidence level upper bound (1,000 cf) | |
|---|---|---|---|---|---|
| All Households | 83 | 1.8 | 1 | 80 | 86 |
| Year Constructed | |||||
| Before 1940 | 103 | 3.2 | 3 | 97 | 109 |
| 1940 to 1949 | 81 | 6.6 | 5 | 71 | 92 |
| 1950 to 1959 | 81 | 3.3 | 3 | 76 | 87 |
| 1960 to 1969 | 74 | 3.6 | 3 | 69 | 79 |
| 1970 to 1979 | 76 | 4.0 | 3 | 71 | 82 |
| 1980 to 1989 | 72 | 4.0 | 3 | 67 | 78 |
| 1990 to 1997 | 80 | 8.0 | 6 | 67 | 93 |
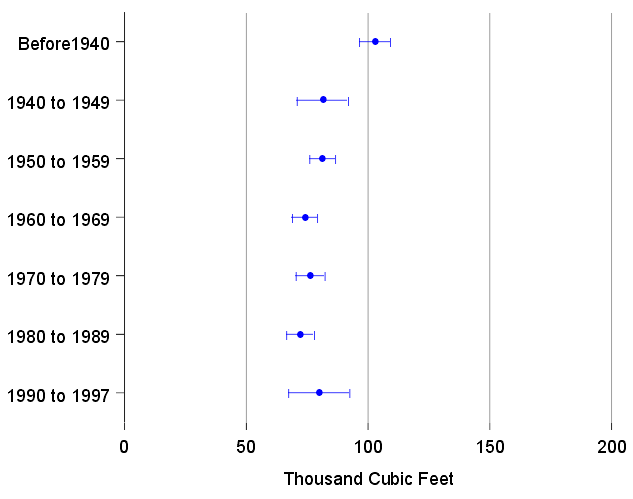
Notes: The data in this table are for households that used natural gas. The standard error is a measure of sampling error and can be used to calculate a confidence range. For example, the estimate for natural gas consumption in units constructed before 1940 is 103 thousand cubic feet (cf) and the standard error is 3 thousand cf. The 95% confidence interval is calculated by multiplying 1.96 times the standard error, and the 95% confidence range is 97 thousand cf to 109 thousand cf. |
|||||
Figure 2. Mean Annual Natural Gas Consumption (and 95% confidence ranges) by Year Constructed, 1997
(thousand cubic feet per household)
Notes: The data in this graph are for households that used natural gas.
The standard error is a measure of sampling error and can be used to calculate a confidence range. For example, the estimate for natural gas consumption in units constructed before 1940 is 103 thousand cubic feet (cf) and the standard error is 3 thousand cf. The 95% confidence interval is calculated by multiplying 1.96 times the standard error, and the 95% confidence range is 97 thousand cf to 109 thousand cf.
Type of Housing Unit
| 5th percentile | 10th percentile | 25th percentile | median | 75th percentile | 90th percentile | 95th percentile | |
|---|---|---|---|---|---|---|---|
| All Households | 12 | 22 | 43 | 74 | 113 | 154 | 188 |
| Type of Housing Unit |
|||||||
| Mobile Home | 17 | 21 | 38 | 63 | 91 | 123 | 141 |
| Single-Family, Detached |
24 | 34 | 56 | 86 | 121 | 162 | 194 |
| Single-Family, Attached |
18 | 22 | 41 | 72 | 114 | 153 | 193 |
| Multifamily, 2 to 4 Units |
11 | 21 | 41 | 73 | 113 | 160 | 201 |
| Multifamily, 5 or More Units |
4 | 5 | 14 | 30 | 52 | 72 | 79 |
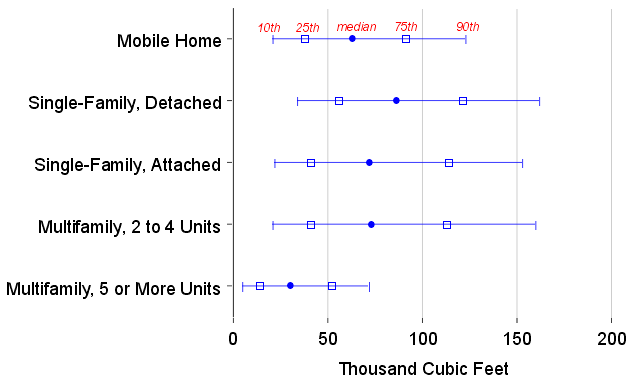
Notes: The data in this table are for households that used natural gas. The percentiles describe the distribution of household electricity consumption data; for example, 25% of households living in mobile homes consumed less than 38 thousand cubic feet and 75% consumed more than that amount. |
|||||||
Figure 1. Annual Natural Gas Consumption Percentiles by Type of Housing Unit, 1997
(thousand cubic feet per household)
Notes: The data in this graph are for households that used natural gas.
The percentiles describe the distribution of household natural gas consumption data; for example, 25% of households living in mobile homes consumed less than 38 thousand cubic feet and 75% consumed more than that amount.
| Natural Gas Consumption per Household (1,000 cf) |
Relative Standard Error (percent) | Standard Error (1,000 cf) |
95% confidence level lower bound (1,000 cf) | 95% confidence level upper bound (1,000 cf) | |
|---|---|---|---|---|---|
| All Households | 83 | 1.8 | 1 | 80 | 86 |
| Type of Housing Unit |
|||||
| Mobile Home | 68 | 8.3 | 6 | 57 | 79 |
| Single-Family, Detached |
94 | 1.9 | 2 | 91 | 97 |
| Single-Family, Attached |
83 | 4.4 | 4 | 76 | 90 |
| Multifamily, 2 to 4 Units |
86 | 6.8 | 6 | 74 | 97 |
| Multifamily, 5 or More Units |
36 | 4.4 | 2 | 33 | 39 |
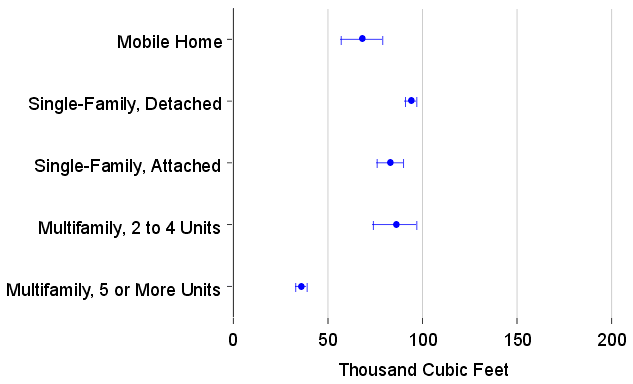
Notes: The data in this table are for households that used natural gas. The standard error is a measure of sampling error and can be used to calculate a confidence range. For example, the estimate for natural gas consumption for mobile homes is 68 thousand cubic feet (cf) and the standard error is 6 thousand cf. The 95% confidence interval is calculated by multiplying 1.96 times the standard error, and the 95% confidence range is 57 thousand cf to 79 thousand cf. |
|||||
Figure 2. Mean Annual Natural Gas Consumption (and 95% confidence ranges) by Type of Housing Unit, 1997
(thousand cubic feet per household)
Notes: The data in this graph are for households that used natural gas.
The standard error is a measure of sampling error and can be used to calculate a confidence range. For example, the estimate for natural gas consumption for households living in mobile homes is 68 thousand cubic feet (cf) and the standard error is 6 thousand cf. The 95% confidence interval is calculated by multiplying 1.96 times the standard error, and the 95% confidence range is 57 thousand cf to 79 thousand cf.
Household Income
| 5th percentile | 10th percentile | 25th percentile | median | 75th percentile | 90th percentile | 95th percentile | |
|---|---|---|---|---|---|---|---|
| All Households | 12 | 22 | 43 | 74 | 113 | 154 | 188 |
| Household Income | |||||||
| Less than 10,000 Dollars | 4 | 7 | 27 | 54 | 87 | 136 | 162 |
| 10,000 to 14,999 Dollars | 7 | 20 | 35 | 64 | 92 | 136 | 161 |
| 15,000 to 19,999 Dollars | 15 | 22 | 36 | 66 | 98 | 145 | 167 |
| 20,000 to 24,999 Dollars | 12 | 21 | 42 | 72 | 110 | 140 | 175 |
| 25,000 to 34,999 Dollars | 12 | 22 | 46 | 75 | 109 | 146 | 175 |
| 35,000 to 49,999 Dollars | 15 | 25 | 47 | 76 | 114 | 161 | 191 |
| 50,000 to 74,999 Dollars | 22 | 37 | 59 | 88 | 123 | 163 | 188 |
| More than 75,000 Dollars |
18 | 27 | 52 | 92 | 129 | 193 | 226 |
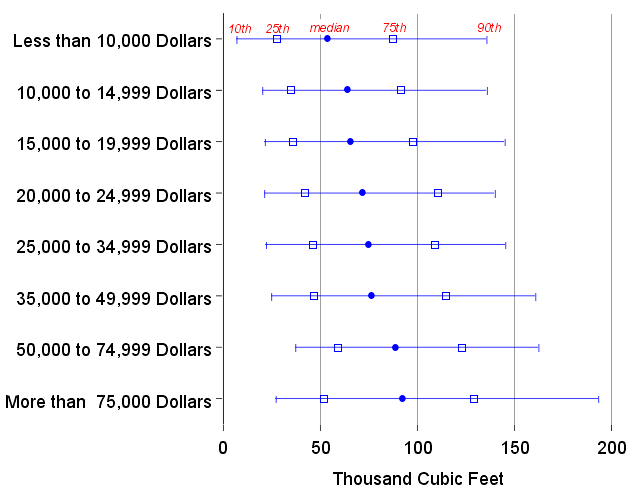
Notes: The data in this table are for households that used natural gas. The percentiles describe the distribution of household natural gas consumption data; for example, 25% of households with incomes less than 10,000 dollars consumed less than 27 thousand cubic feet (cf) and 75% consumed more than that amount. |
|||||||
Figure 1. Annual Natural Gas Consumption Percentiles by Household Income, 1997
(thousand cubic feet per household)
Notes: The data in this graph are for households that used natural gas.
The percentiles describe the distribution of household natural gas consumption data; for example, 25% of households with incomes less than 10,000 dollars consumed less than 27 thousand cubic feet (cf) and 75% consumed more than that amount.
| Natural Gas Consumption per Household (1,000 cf) |
Relative Standard Error (percent) | Standard Errors (1,000 cf) | 95% confidence level lower bound (1,000 cf) | 95% confidence level upper bound (1,000 cf) | |
|---|---|---|---|---|---|
| All Households | 83 | 1.8 | 1 | 80 | 86 |
| Household Income | |||||
| Less than 10,000 Dollars |
65 | 5.2 | 3 | 58 | 71 |
| 10,000 to 14,999 Dollars | 71 | 5.0 | 4 | 64 | 78 |
| 15,000 to 19,999 Dollars | 74 | 3.4 | 3 | 69 | 79 |
| 20,000 to 24,999 Dollars | 80 | 4.1 | 3 | 74 | 87 |
| 25,000 to 34,999 Dollars | 82 | 3.8 | 3 | 76 | 88 |
| 35,000 to 49,999 Dollars | 87 | 3.4 | 3 | 81 | 93 |
| 50,000 to 74,999 Dollars | 96 | 2.9 | 3 | 90 | 101 |
| More than 75,000 Dollars | 100 | 4.5 | 4 | 91 | 109 |
Notes: The data in this table are for households that used natural gas. The standard error is a measure of sampling error and can be used to calculate a confidence range. For example, the estimate for electricity consumption for households with incomes less than 10,000 dollars is 65 thousand cubic feet (cf) and the standard error is 3 thousand cf. The 95% confidence interval is calculated by multiplying 1.96 times the standard error, and the 95% confidence range is 58 thousand cf to 71 thousand cf. |
|||||
Figure 2. Mean Annual Natural Gas Consumption (and 95% confidence ranges) by Household Income, 1997
(thousand cubic feet per household)
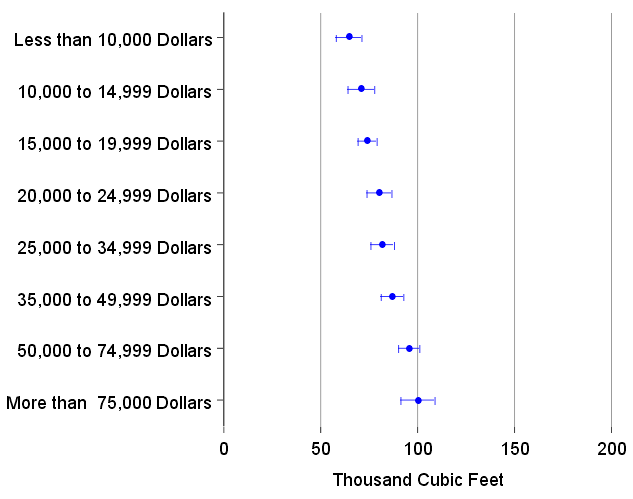
Notes: The data in this graph are for households that used natural gas.
The standard error is a measure of sampling error and can be used to calculate a confidence range. For example, the estimate for electricity consumption for households with incomes less than 10,000 dollars is 65 thousand cubic feet (cf) and the standard error is 3 thousand cf. The 95% confidence interval is calculated by multiplying 1.96 times the standard error, and the 95% confidence range is 58 thousand cf to 71 thousand cf.

