

EIA’s top accomplishments of 2018
For the U.S. Energy Information Administration (EIA), 2018 was truly a year of notable accomplishments. Check out these highlights of EIA products and programs in 2018.
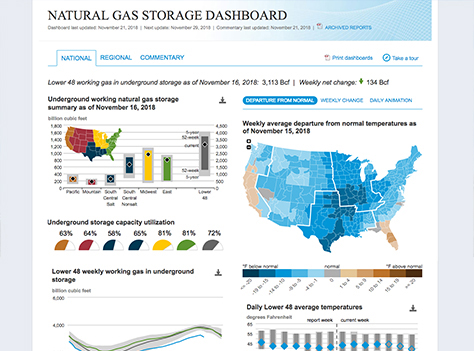
Natural Gas Storage Dashboard launch
The Natural Gas Storage Dashboard is a new, interactive tool that provides weekly context to EIA's only Principal Federal Economic Indicator—the Weekly Natural Gas Storage Report (WNGSR). Launched on September 13, 2018, the dashboard is a comprehensive way for users to identify Lower 48 and regional storage activity and the key market fundamentals that affect natural gas underground storage activity.

EIA’s response to Hurricanes Florence and Michael and the addition of new layers to the Energy Disruptions Map
As Hurricane Florence and then Hurricane Michael threatened the U.S. Southeast in September and October, EIA quickly responded with hurricane status reports and related Today in Energy articles that provided information on each storm’s potential to disrupt the energy system and analyses of the resulting impacts after landfall. EIA also added new data layers for wildfires and earthquakes to the Energy Disruptions Map. Through social media, EIA connected consumers with useful EIA tools in the event of a natural disaster such as the Energy Disruptions Map, the U.S. Electric System Operating Data tool, the Status of U.S. Nuclear Outages page, and the Flood Vulnerability Assessment Map.
Photo source: National Oceanic and Atmospheric Administration, https://www.nesdis.noaa.gov/content/hurricane-florence-nears-east-coast

More than 20 new end-use estimates added to EIA’s Residential Energy Consumption Survey
EIA’s 2015 Residential Energy Consumption Survey (RECS) introduced estimates of energy consumption for many more energy end uses. For electricity, the number of estimated end uses was expanded from 4 to 26 when we added estimates for equipment such as dishwashers, clothes washers, clothes dryers, televisions, and lighting.

Expanded petroleum export data
Starting with the May 2018 release of petroleum export data, EIA began publishing U.S. petroleum export data by region of origin and by country of destination. Before this change, users could see the total amount exported from each U.S. Petroleum Administration for Defense District (PADD), but they could not see the actual destination associated with those PADD-level exports.
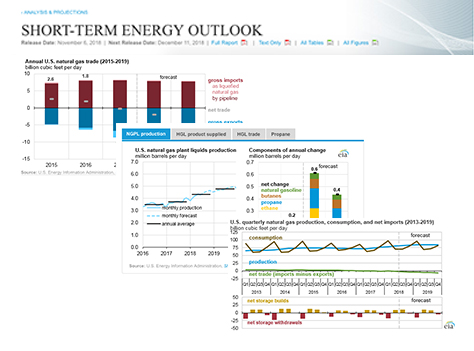
New natural gas and HGL figures added to the Short-Term Energy Outlook
In July, EIA’s Short-Term Energy Outlook (STEO) redesigned its standard set of figures to improve the visual representation of the forecasted data. In addition to the redesign, EIA added two new natural gas figures and four new hydrocarbon gas liquids (HGL) figures to the standard set of monthly figures to capture the changing dynamics in these markets. The effort involved year-long collaboration among several EIA teams.
Additions to the Electric Power Annual 2017 and the addition of Puerto Rico to Preliminary Monthly Electric Generator Inventory
The Electric Power Annual 2017 now has a new chapter (Chapter 11—U.S. Territories) that includes sales, revenue, customer counts, and average prices of electricity for Puerto Rico, American Samoa, Guam, the Northern Mariana Islands, and the U.S. Virgin Islands. In addition, a new table (Table 2.11—Ultimate customers by end-use sector, by state) shows U.S. customer counts by sector and by state. In addition, existing, retired, and proposed power plants in Puerto Rico were added to EIA’s Preliminary Monthly Electric Generator Inventory. This EIA report includes generating units at power plants with a combined nameplate capacity of one megawatt (MW) or greater.
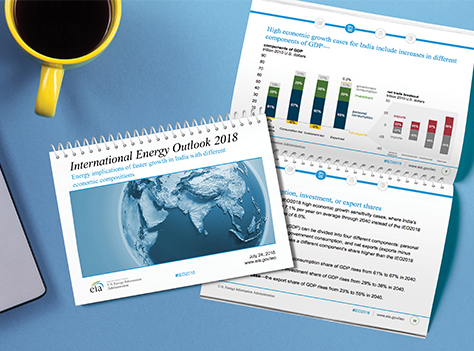
Detailed analysis about three key international regions published in IEO2018
EIA’s International Energy Outlook 2018 (IEO2018) focused on how different macroeconomic conditions and economic growth rates might affect international energy markets in three key regions of the world: China, India, and Africa. EIA updated the IEO2017 Reference case with new macroeconomic information and varied economic growth, industrial economic activity, and world oil price assumptions for China, India, and Africa to create these side cases.
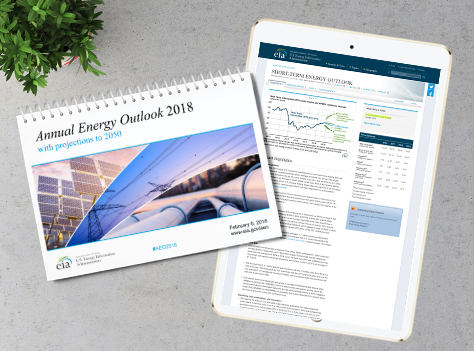
AEO2018 with many detailed side cases
EIA’s Annual Energy Outlook 2018 included many detailed side cases based on an improved set of models. The side cases explored the topics of oil and natural gas technology, nuclear power, autonomous vehicles, oil production in the Arctic National Wildlife Refuge, and a more detailed set of alternative policy scenarios than in previous Annual Energy Outlook forecasts. Support for these analyses included the introduction of a new natural gas market model, an improved representation of natural gas production, and the consideration of battery storage technology and autonomous vehicles in the model that produced the projections.

Enhanced Annual Coal Report
A new Executive Summary and several new and modified tables were incorporated into the Annual Coal Report. These enhancements summarize key trends in coal production, productivity, and prices, and they extend several coal industry data series back to 1949. This product expansion now also provides volumes and average prices of coal imports and exports including breakouts for metallurgical and thermal coal. These improvements provide timely explanations of recent developments in the coal industry at a time when the industry faces reduced coal consumption at U.S. power plants and strong demand for U.S. coal internationally.

New Monthly Solar Photovoltaic Module Shipments Report
The new Monthly Solar Photovoltaic Module Shipments Report provides monthly updates on the size and status of the industry, which includes the quantity of peak kilowatts manufactured, the value of modules, and the state-level destinations for this fastest-growing energy source in the United States.
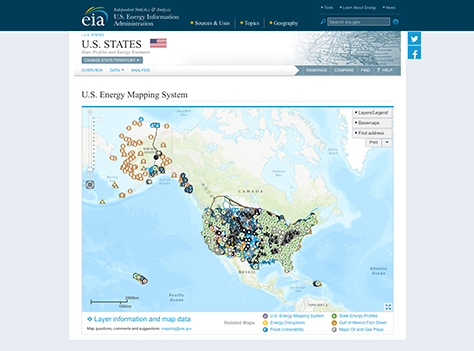
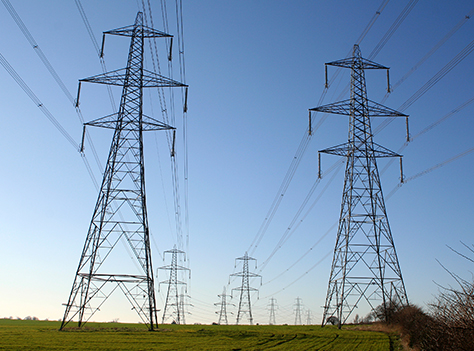
New layers in U.S. Energy Mapping System
EIA’s U.S. Energy Mapping System is an interactive, comprehensive visual reference for energy infrastructure in the United States. Several layers in the system were updated this year. Users can now see locations of several types of energy infrastructure, including wind turbines, coal mines, oil and natural gas wells, high-voltage electric transmission lines, natural gas pipelines, and U.S. border-crossing points of electric transmission lines and liquids and natural gas pipelines.

40 years of SHOPP data and 35 years of the Petroleum Marketing Monthly
Since 1978, the State Heating Oil and Propane Program (SHOPP) has been a joint effort between EIA and state energy offices to collect state-level residential heating oil and propane price data in states where the residential use of heating oil and propane is common. Every other year, EIA hosts a SHOPP workshop, which brings representatives from state energy offices together to discuss the heating oil and propane markets. This year also marks the 35th anniversary of the Petroleum Marketing Monthly (PMM) report. The PMM provides statistics on crude oil costs and various refined petroleum product sales volumes and prices at the national, regional, and state levels.