
Share of natural gas production in U.S. tight oil plays increased over the last decade
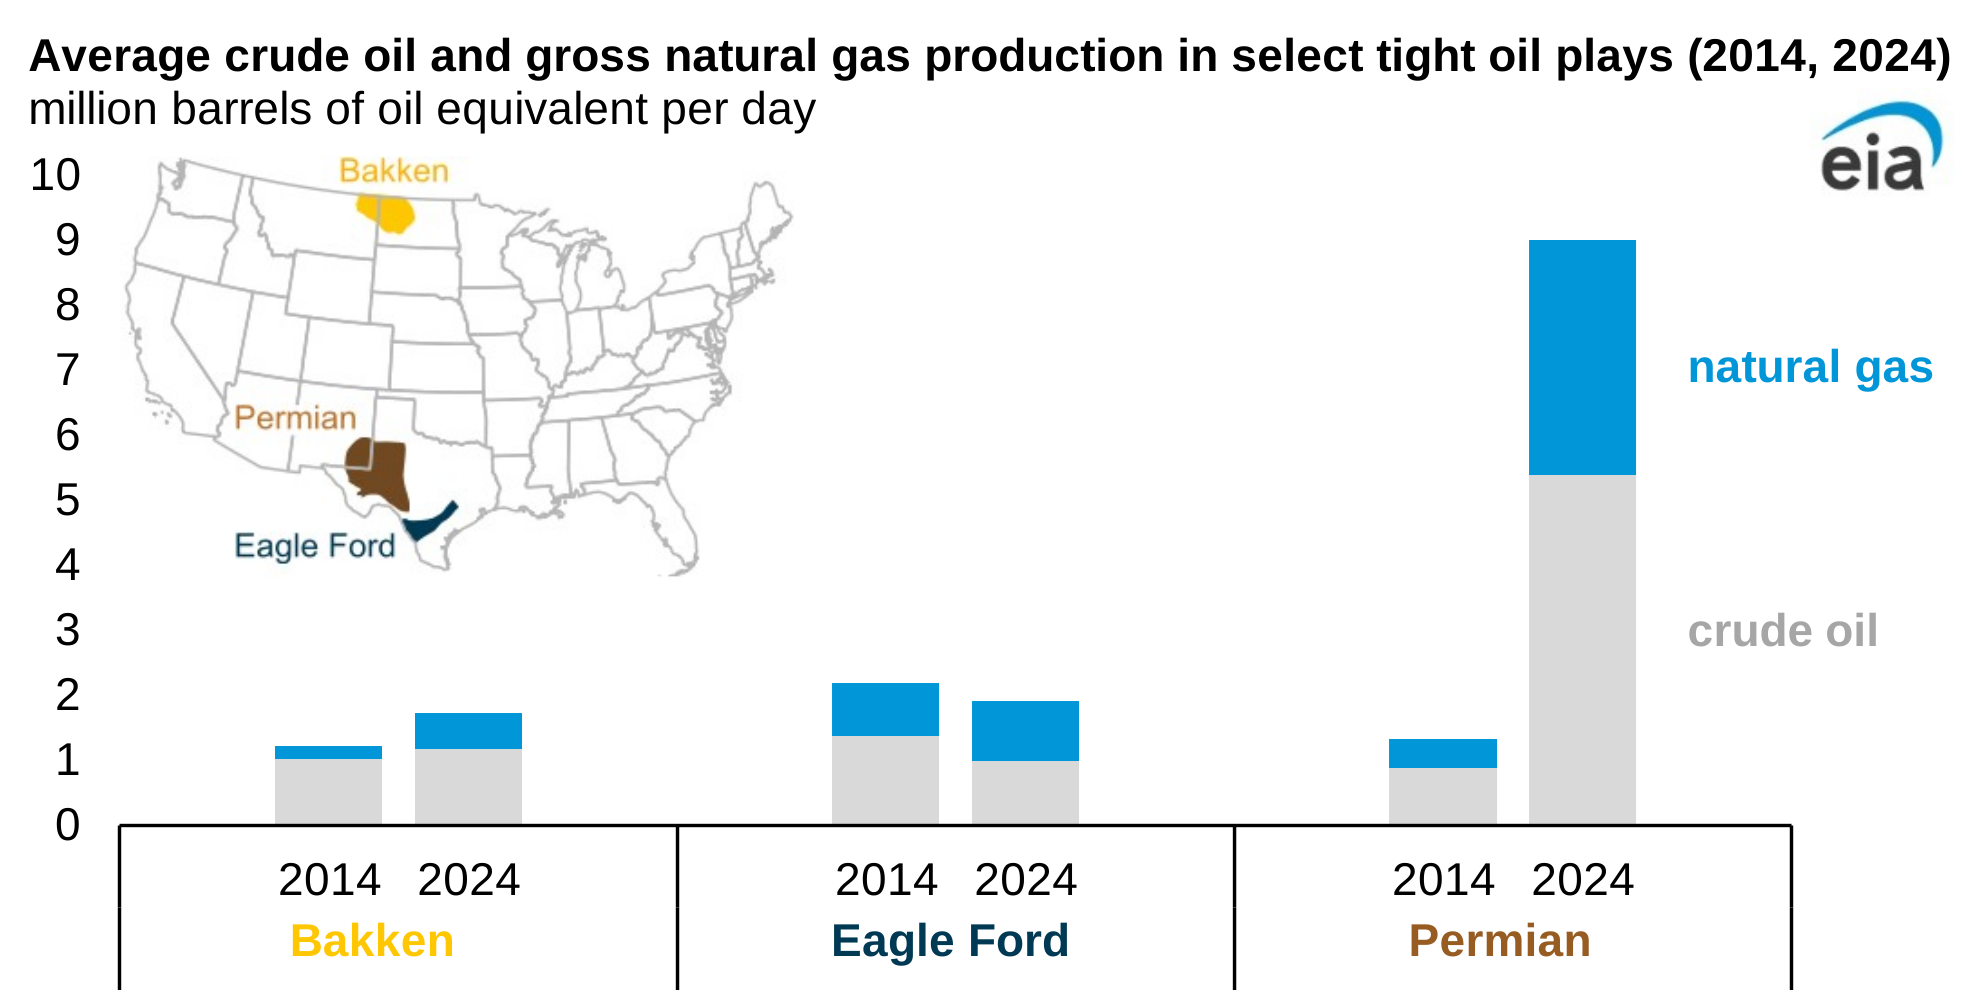
Note: 2024 represents year-to-date data through September. To calculate the barrel of oil equivalent, we use a conversion factor of 6,000 cubic feet of gross natural gas production per 1 barrel of oil.
Natural gas produced from the three largest tight oil-producing plays in the United States has increased in the last decade. Natural gas comprised 40% of total production from the Bakken, the Eagle Ford, and the Permian compared with 29% in 2014.
Combined crude oil and natural gas production from these plays more than doubled over this period as hydraulic fracturing—also known as fracking—and horizontal drilling have allowed producers to access and extract more crude oil and natural gas from tight formations. However, production of associated natural gas, which is natural gas produced from predominantly oil wells, has increased more rapidly from these tight oil plays. Natural gas production from these plays more than tripled—an increase of 22 billion cubic feet per day (Bcf/d)—over the period compared with crude oil output, which more than doubled—an increase of 4 million barrels per day (b/d).
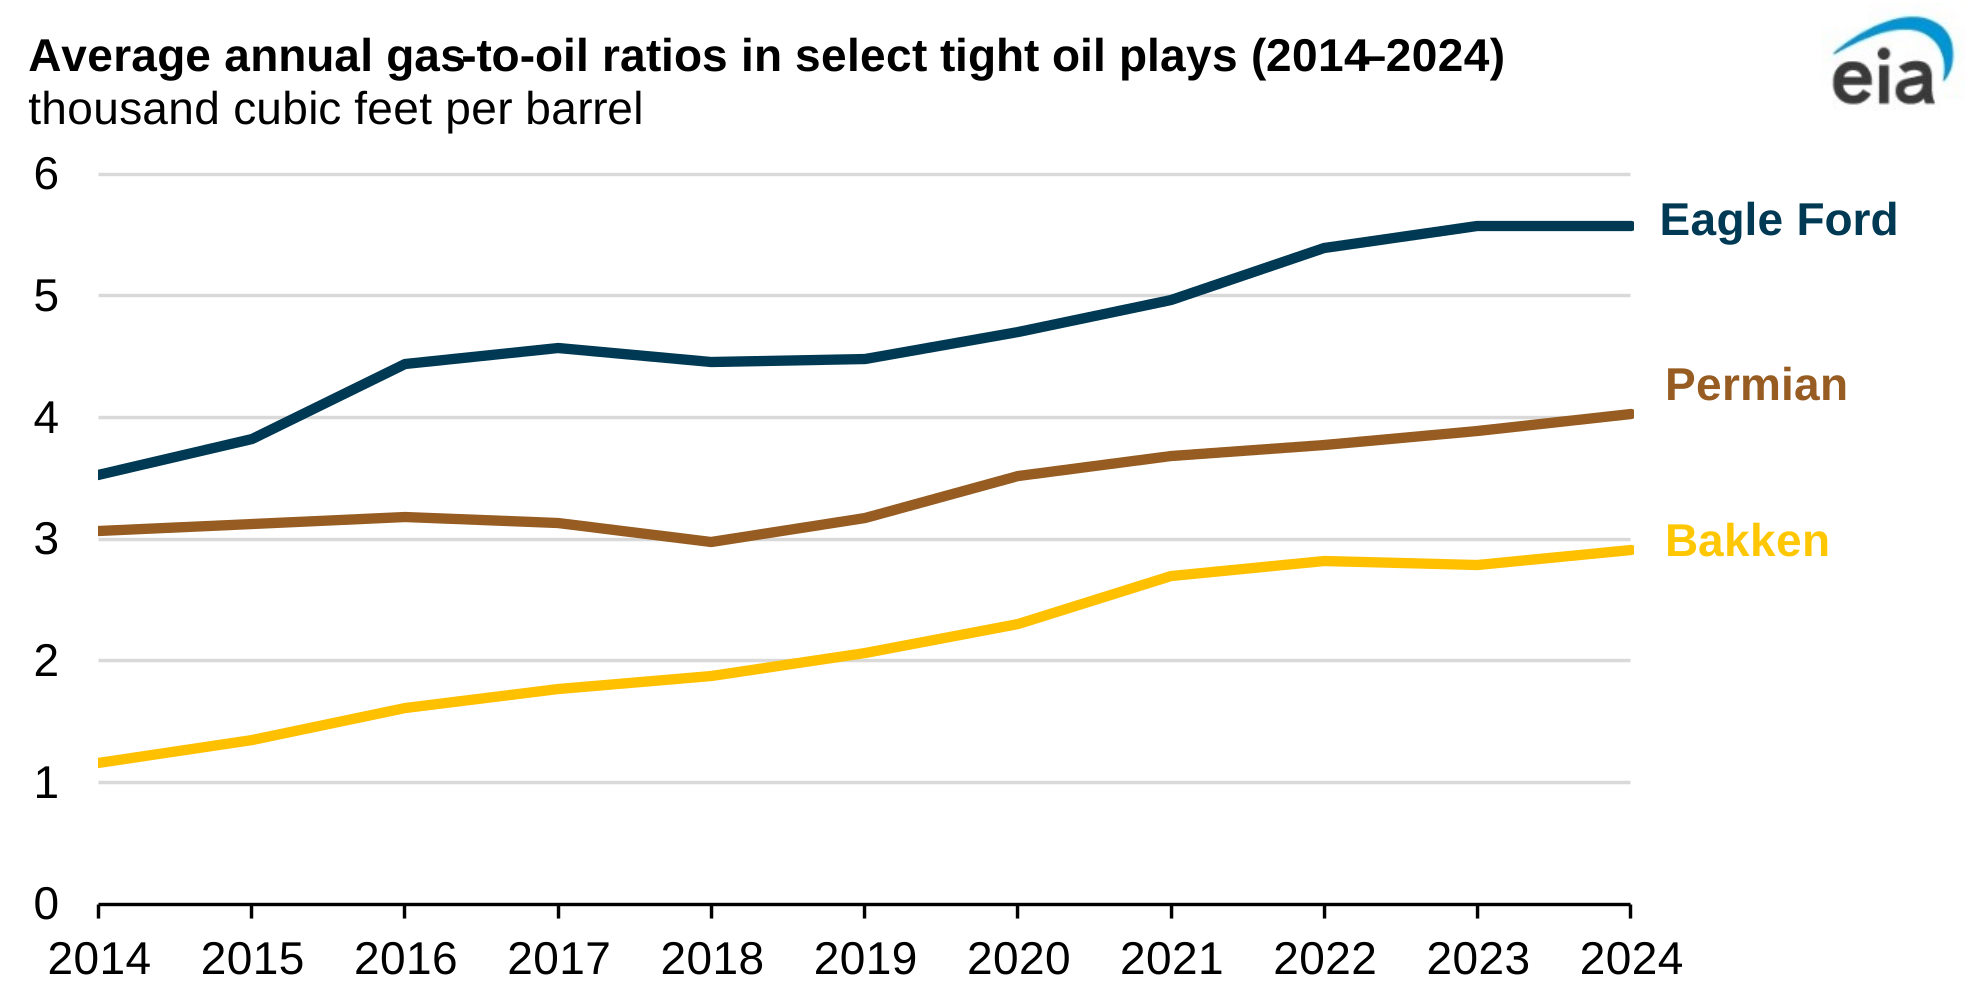
We define oil wells as those with a gas-to-oil ratio (GOR) of less than or equal to 6.0 thousand cubic feet of natural gas per barrel of oil produced (Mcf/b). We classify wells with a GOR of more than 6.0 Mcf/b as natural gas wells. Any increase in the GOR in an oil well means more natural gas per barrel of oil is being produced. The GOR for a play represents the average share of natural gas production from its individual wells.
Historically, the Permian, Bakken, and Eagle Ford plays have predominantly consisted of oil wells, resulting in lower GORs for these plays.
As more oil and natural gas are released within a well, the GOR tends to progressively increase, increasing the volume of associated natural gas produced per every barrel of oil. Pressure within the reservoir declines as more oil is brought to the surface, which allows more natural gas to be released from the geologic formation. The pressure will also decrease as more wells are concentrated within an area.
Note: 2024 represents year-to-date data through September.
In the Permian play, located in West Texas and southeastern New Mexico, the share of natural gas produced relative to crude oil has remained relatively stable, although the GOR has steadily risen from 3.1 Mcf/b (34% of total production) in 2014 to 4.0 Mcf/b (40%) in 2024. Natural gas production in the Permian, the largest producing tight oil play in the United States, increased eight-fold in 2024 through September compared with 2014, and crude oil production increased six-fold.
In the Bakken play, located in North Dakota and Montana, the share of natural gas produced relative to crude oil has historically been relatively low, averaging only 1.2 Mcf/b (16% of total production) in 2014. However, the GOR increased to 2.9 Mcf/b (33%) in 2024, with average gross natural gas production increasing 186% compared with 2014 while crude oil production increased just 14%.
In the Eagle Ford play, located in southwest Texas, the share of natural gas produced relative to crude oil has remained the highest among these plays, increasing from 3.5 Mcf/b (37% of total production) to 5.6 Mcf/b (48%). This increased GOR reflects a 14% increase in average natural gas production and a 28% decrease in average crude oil production in 2024 through September compared with 2014.
Principal contributor: Trinity Manning-Pickett