
North Dakota, Montana, and Wyoming consume the most residential energy per capita
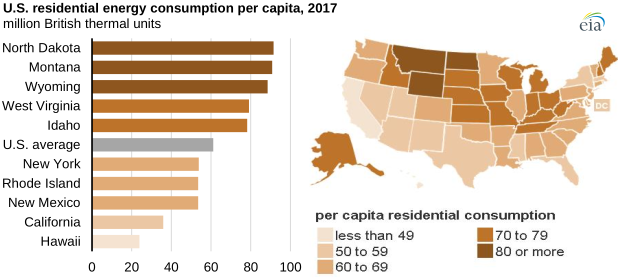
In 2017, people in the United States consumed an average of 61 million British thermal units (Btu) of energy per capita in the residential sector, a 2% decrease from 2016 and the lowest level since 1967. Data from the U.S. Energy Information Administration’s (EIA) Key Statistics and Indicators section of the State Energy Data System (SEDS) show that in 2017, North Dakota had the highest residential energy consumption per capita of any state at 91.5 million Btu and Hawaii had the lowest at 23.9 million Btu.
States with higher per capita residential energy consumption generally experience temperature extremes, have lower population density, and are more likely to have people living in single-family homes than other regions of the country.
Larger homes tend to consume more energy than smaller homes and apartments. Apartments are generally smaller than single-family homes, and they are often partially insulated by adjacent apartments. According to EIA’s Residential Energy Consumption Survey (RECS) data, in 2015, the average single-family detached home consumed nearly three times more energy than an apartment with five or more units in the same building. According to RECS, more than half of all energy use in homes is for heating and air conditioning.
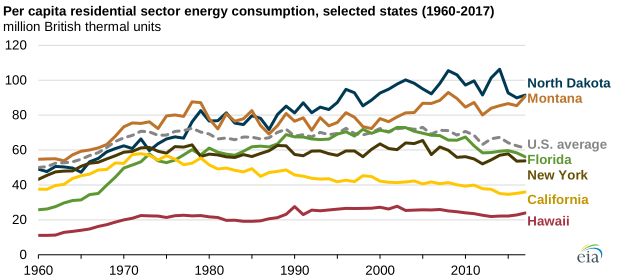
Hawaii, California, New Mexico, Rhode Island, and New York were among the states with the lowest per capita residential sector energy consumption in 2017. Rhode Island and New York are densely populated. Hawaii, California, and New Mexico have relatively moderate climates. In Hawaii, nearly two-thirds of households have no heating system.
U.S. per capita residential consumption averaged 50 million Btu in 1960, the earliest year for which EIA has data. The U.S. average has decreased 16% since reaching a peak of 73 million Btu in 2005. Nearly every state has seen decreased per capita residential consumption since 2005—only Montana, Wyoming, and New Hampshire have seen increases.
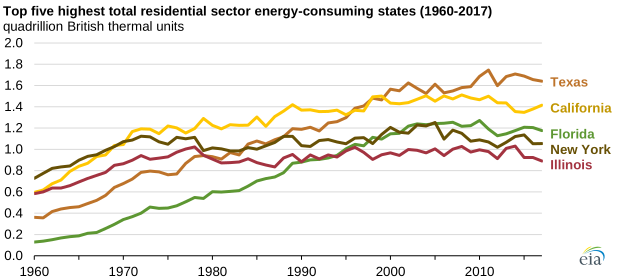
Florida, which was once well below the average for U.S. per capita residential energy consumption, has experienced the most growth in per capita residential energy since 1960. From 1960 through 2017, Florida’s population more than quadrupled, but the state’s residential energy consumption increase outpaced its population growth.
Although New York is the fourth-highest state in terms of total residential energy consumption, its highly dense population in large cities helped to make it the fifth-lowest state for residential consumption per capita in 2017. Homes in New York consumed both more natural gas and petroleum than homes in any other state in 2017.
Principal contributors: Mickey Francis, Olivia Clark