
U.S. average retail gasoline prices ended the year lower than they started
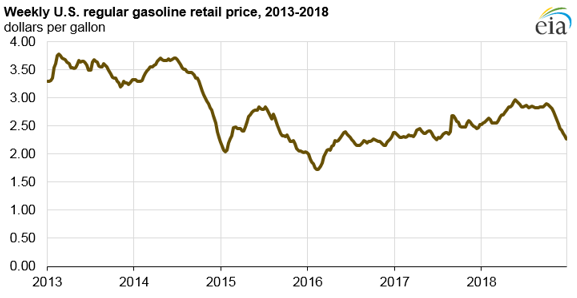
U.S. regular retail gasoline prices averaged $2.72 per gallon (gal) in 2018, 30 cents/gal (13%) higher than in 2017 and 57 cents/gal higher than in 2016. However, a rapid price decline beginning in October led to U.S. average regular gasoline prices ending the year lower than they began for the first time since 2015. In 5 of the 10 cities for which EIA collects weekly retail price data, gasoline prices exceeded $3.00/gal at least once in 2018.
Rising crude oil prices and high levels of gasoline demand contributed to rising gasoline prices from January through May. Gasoline prices subsequently remained relatively stable from June through October before falling oil prices, high gasoline inventories, and flattening U.S. gasoline demand helped bring the U.S. average price down by nearly $0.50 per gallon between October and December. The national price for gasoline declined for 12 weeks in a row at the end of 2018, which marked the longest consecutive weekly drop since the 17-week decline from October 2014 through January 2015. Although prices declined across the country, the extent of the decline varied greatly within the regions.
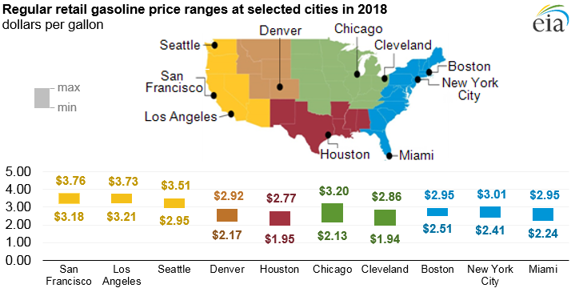
Each Monday, EIA collects and publishes data on retail gasoline and diesel fuel prices for 10 cities, 9 states, 5 regions, and the United States as a whole. Gasoline prices across the country reflect differences in gasoline specifications, taxes, and supply and demand balances in regional markets.
East Coast (Boston, New York City, and Miami). In New York City and Miami, regular retail gasoline prices were lowest in December, but prices in Boston were lowest in January. In both New York City and Boston, prices peaked in May at the beginning of the summer driving season. Average prices for the entire East Coast region moved within a range of $2.25/gal to $2.91/gal during the year.
Midwest (Chicago and Cleveland). The Midwest covers a large geographic area consisting of many semi-connected markets. Prices in Chicago were higher than prices in Cleveland and the Midwest regional average in every week during 2018. Of the cities for which EIA collects data, Cleveland’s gasoline prices were the second lowest in the country for 25 weeks and the lowest for 2 weeks.
Gulf Coast (Houston). Gulf Coast retail gasoline prices tend to be the lowest in the country. The region is home to half of all U.S. refining capacity and produces substantially more gasoline than it consumes. In addition, gasoline taxes in the region are among the lowest in the country. Retail gasoline prices in Houston were the lowest of the 10 cities for which EIA collected data for 50 weeks in 2018. Gasoline prices in Houston were lowest the week of December 31 at $1.95/gal.
Rocky Mountains (Denver). The Rocky Mountains gasoline demand centers are geographically dispersed and are separated from sources of supply by mountain ranges and large expanses of wilderness and rural lands, contributing to higher prices in the region. The region’s average gasoline prices were the second highest in the country for 38 weeks of 2018. Denver, however, is well-supplied from a number of pipelines and nearby refineries, and retail gasoline prices in the city were the second lowest of the 10 cities surveyed for 20 weeks of 2018. Average gasoline prices for the entire Rocky Mountains region moved within a range of $2.42/gal to $3.01/gal during the year.
West Coast (Los Angeles, San Francisco, and Seattle). Gasoline prices on the West Coast tend to be higher than in other parts of the country because of strict fuel specifications in California, the region's relative isolation from other markets, and higher state and local taxes. The October 9, 2018, rupture of Enbridge’s BC Pipeline near Prince George, British Columbia, forced some refineries in Washington to cut production because the pipeline carries the natural gas used to operate refining units. On October 15, the Monday following the pipeline rupture, the retail price of gasoline in Seattle rose 9 cents/gal from the previous week’s value, Seattle’s largest weekly increase since mid-2015.
Of the 10 cities for which EIA collects data, retail gasoline prices in San Francisco were the highest for all but the first 14 weeks of 2018, when prices were highest in Los Angeles. San Francisco gasoline prices peaked in October at $3.76/gal.
Principal contributor: Kelsey Hallahan
Tags: prices, gasoline, liquid fuels, oil/petroleum