
U.S. ethane production reached a record 3.0 million barrels per day in May 2024
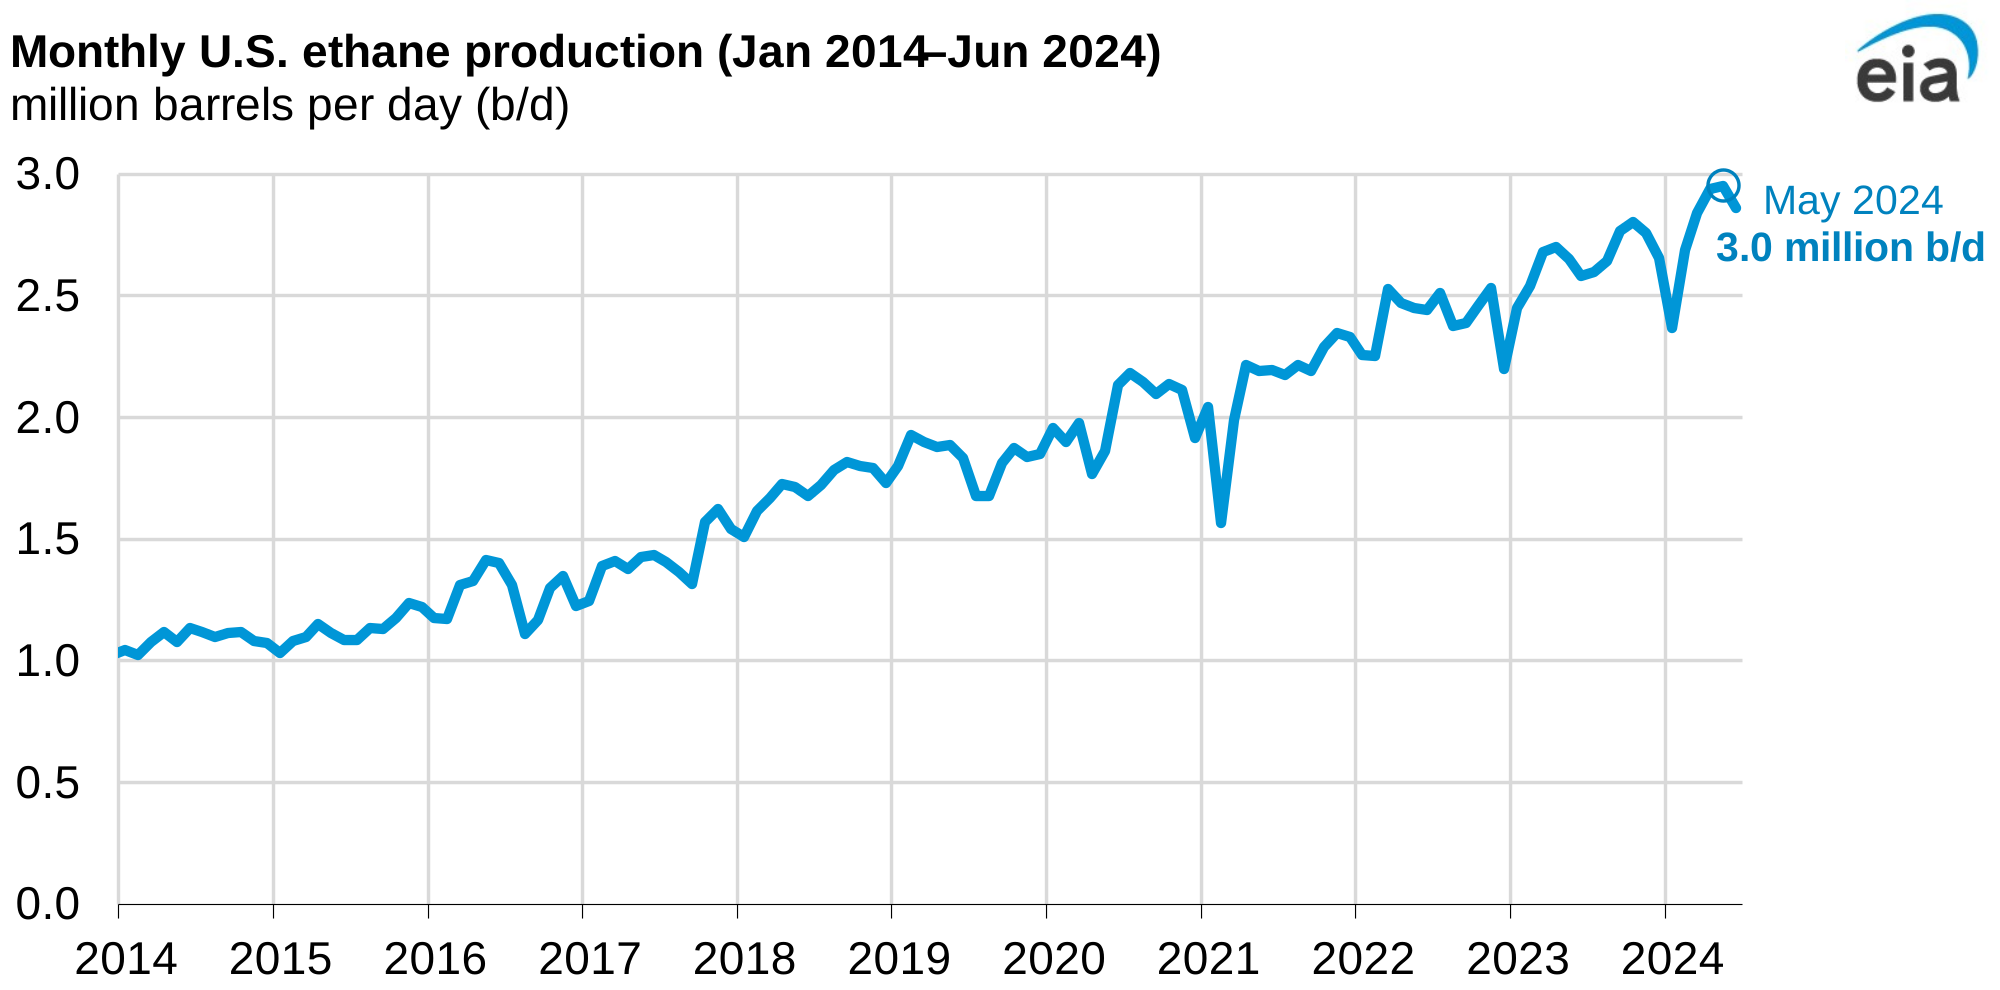
U.S. ethane production increased steadily over the last decade and reached a record of 3.0 million barrels per day (b/d) in May 2024. Ethane production in the first half of 2024 (1H24) averaged a record 2.8 million b/d, according to data from our Petroleum Supply Monthly. The increase was driven by more natural gas and ethane production in the Permian Basin, which spans Texas and New Mexico.
Ethane serves mainly as a petrochemical feedstock to produce ethylene, which is used to make plastics and resins. Continued growth in ethane consumption in the global petrochemical sector, increasing proportions of ethane derived from U.S. natural gas production, and favorable production economics have driven steady increases in ethane production in recent years.
In the United States, almost all ethane is recovered at natural gas processing plants, which remove ethane and other natural gas plant liquids (NGPL) from raw natural gas. During 1H24, U.S. marketed natural gas production, which includes dry natural gas and NGPLs before they are separated out, averaged a record 112.8 billion cubic feet per day (Bcf/d), 1.0 Bcf/d more than the 1H23 average.
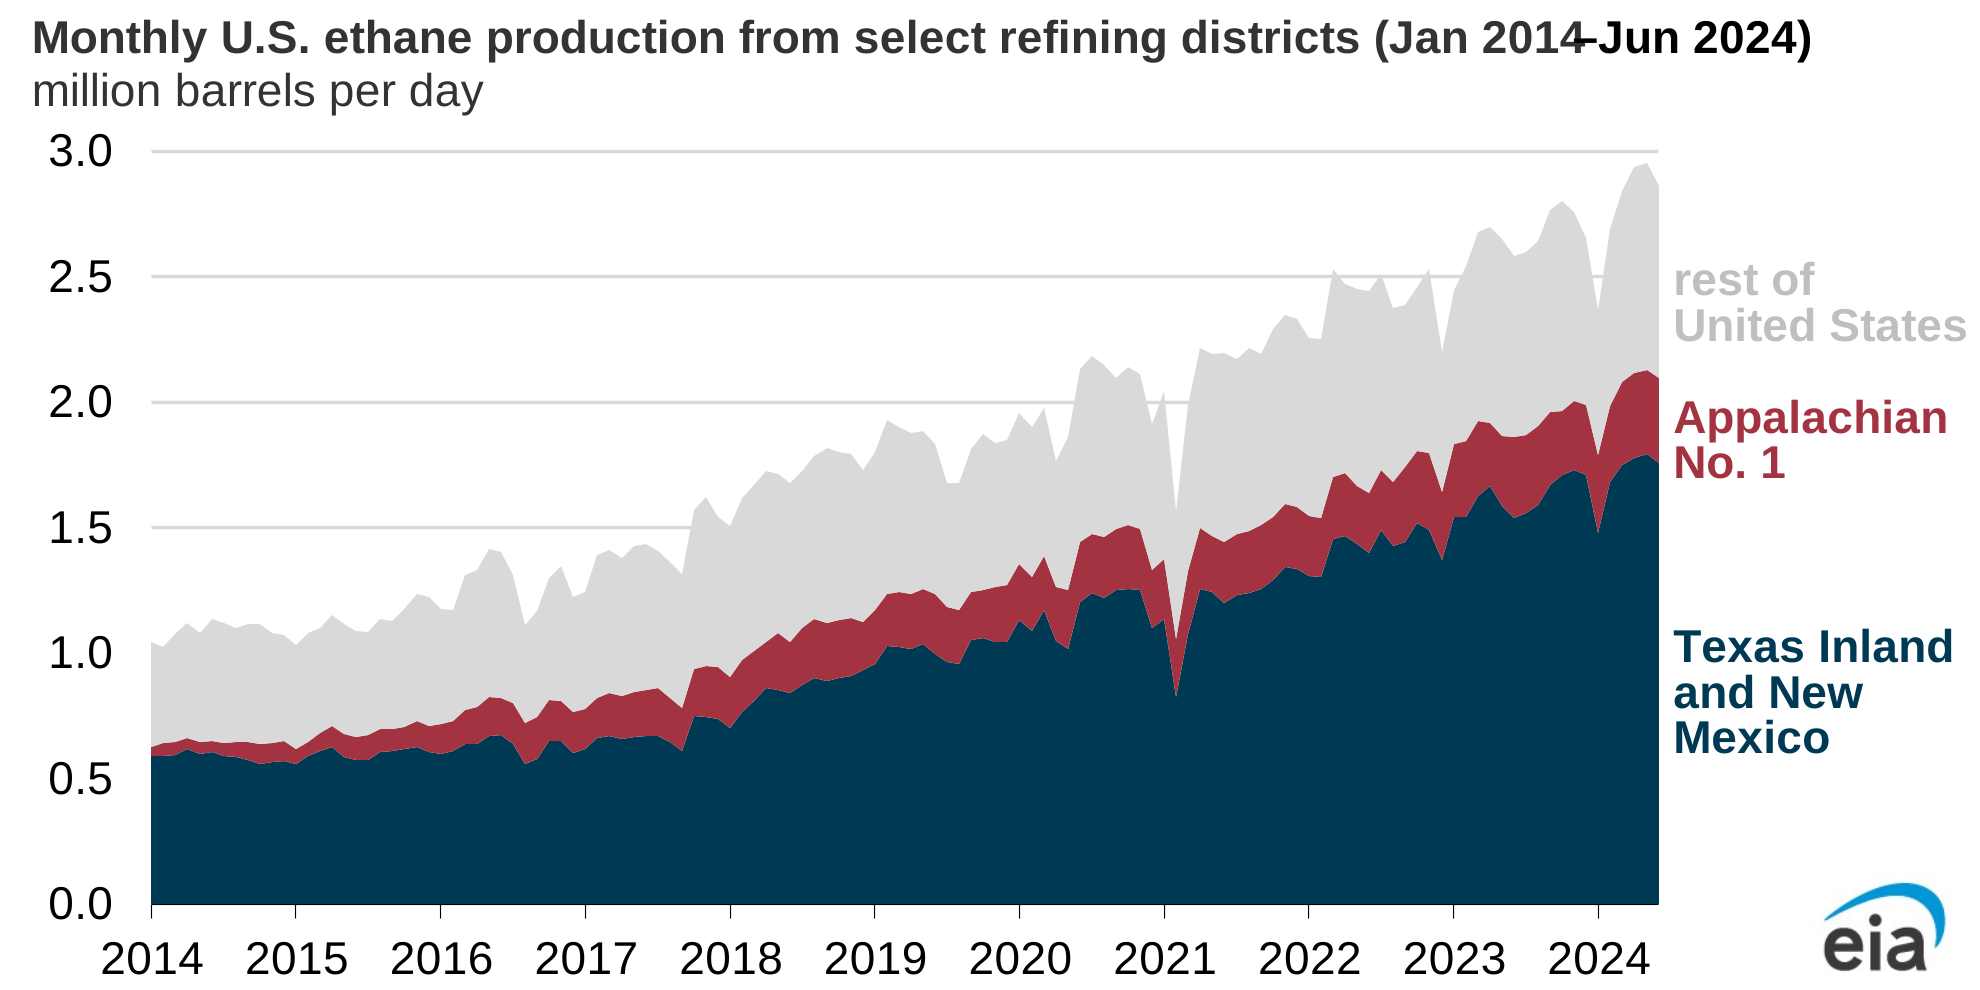
Ethane production in the Texas Inland and New Mexico refining districts, which include the Permian Basin, accounted for 62% of U.S. ethane production during 1H24, slightly more than the 60% share in 1H23. Ethane production in these two districts averaged 1.7 million b/d in 1H24, a 7% (0.1 million b/d) increase from 1H23. Ethane production in the Appalachian No. 1 refining district, which straddles most of the Appalachian Basin production area in Pennsylvania and West Virginia, also increased during 1H24, averaging 327,000 b/d, up from 292,000 b/d in 1H23. Ethane production in other refining districts remained essentially unchanged from 1H23.
U.S. ethane production continued increasing to meet growing demand from domestic and international consumers. Consumption of ethane in the United States in 1H24 averaged 2.3 million b/d, up from 2.1 million b/d in 1H23, while U.S. ethane exports averaged 470,000 b/d, down 17,000 b/d compared with 1H23. The United States began exporting ethane in 2014 to petrochemical plants in Canada and became the world’s largest exporter of ethane in 2015, when tanker exports to Europe began. The most common destinations for ethane exports in 1H24 were China (45% of U.S. ethane exports; 212,000 b/d), Canada (15%; 70,000 b/d), and India (14%; 65,000 b/d).
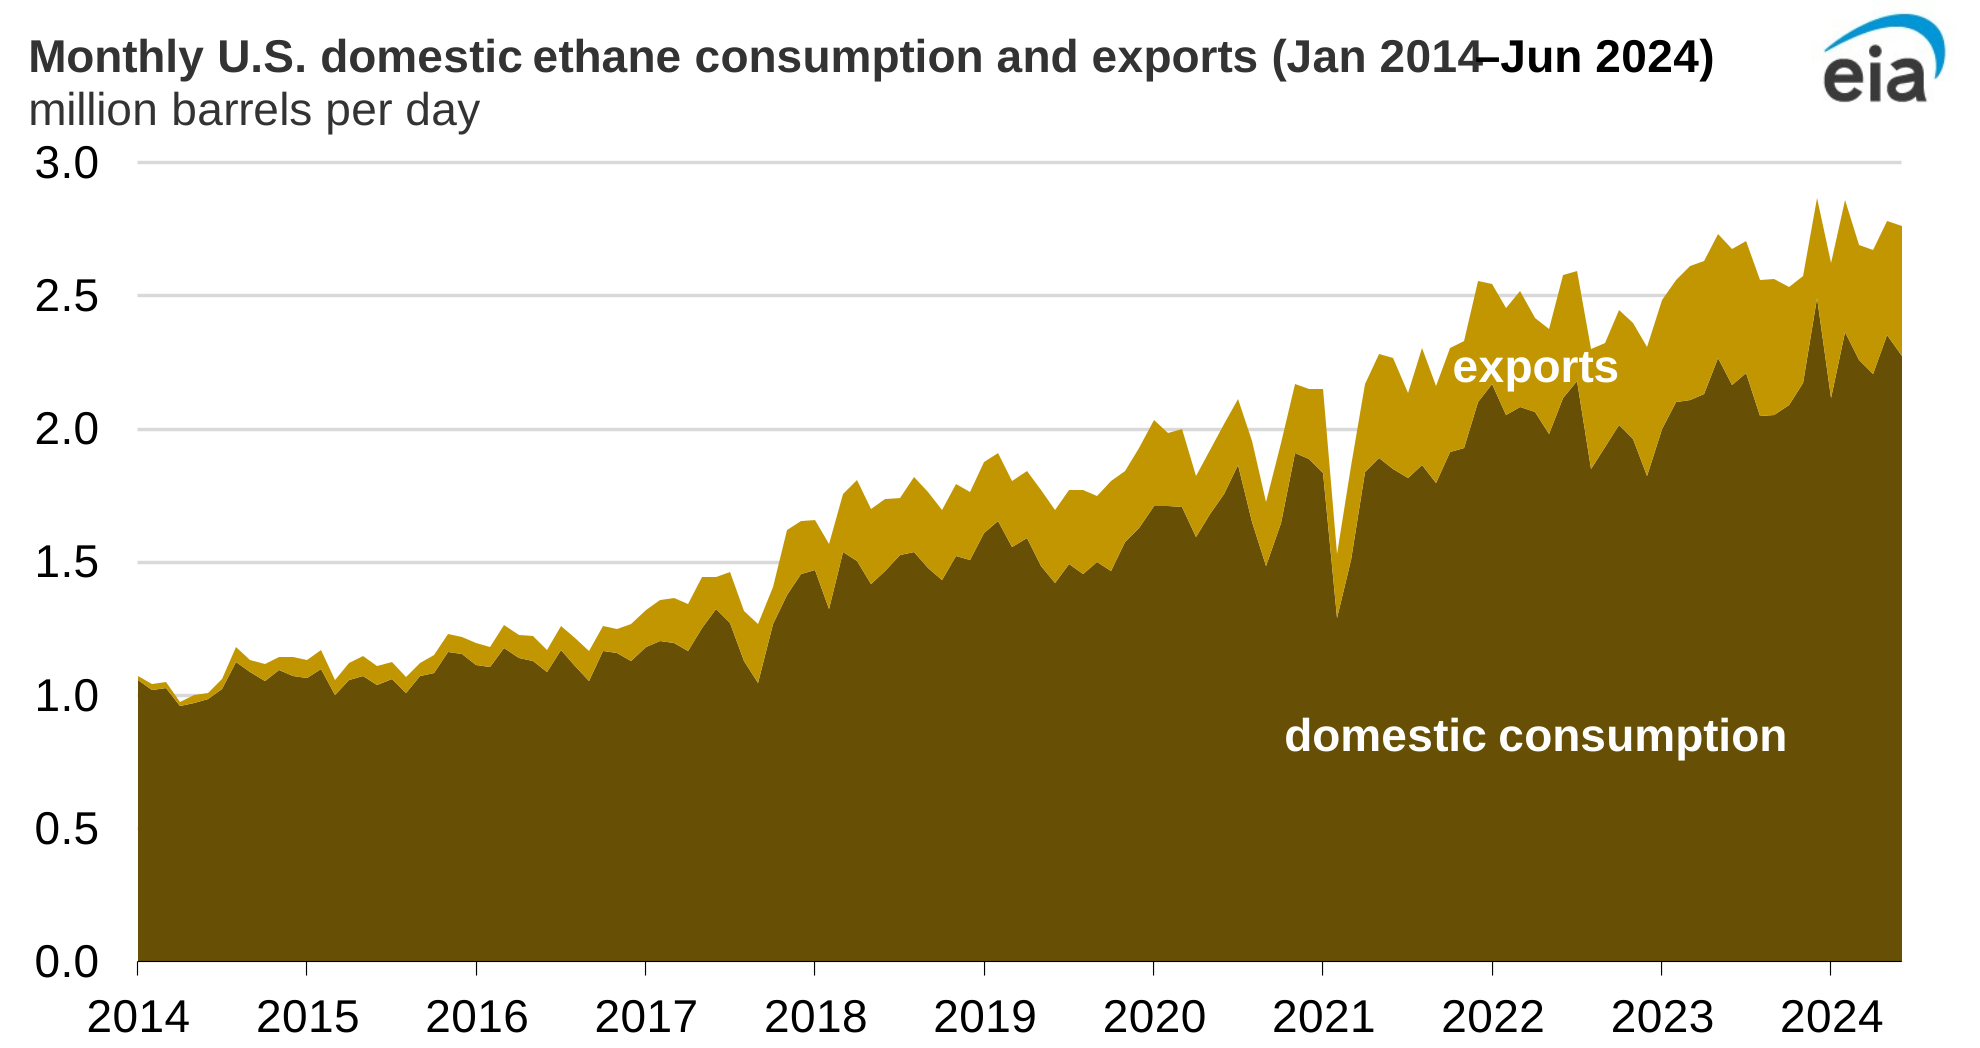
In our Short-Term Energy Outlook, we expect ethane production to average 2.8 million b/d in both 2024 and 2025, a 5% increase compared with 2023. We expect domestic ethane consumption to average 2.3 million b/d in both 2024 and 2025, a 5% increase compared with 2023. We expect U.S. net ethane exports to rise to 490,000 b/d in 2024 and 520,000 b/d in 2025, an 11% increase from 2023 to 2025.
Principal contributor: Jordan Young
Tags: ethane, production/supply