|
Download Data (XLS File) |
|
||||||||
|
||||||||
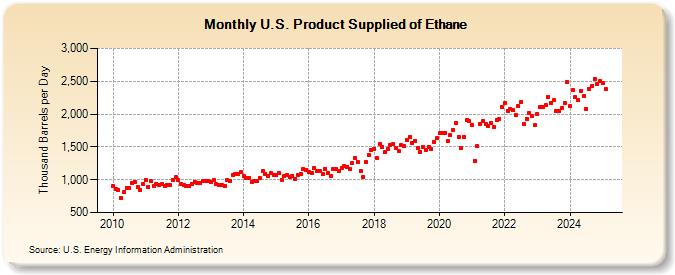
| U.S. Product Supplied of Ethane (Thousand Barrels per Day) | ||||||||
| Year | Jan | Feb | Mar | Apr | May | Jun | Jul | Aug | Sep | Oct | Nov | Dec |
|---|---|---|---|---|---|---|---|---|---|---|---|---|
| 2010 | 903 | 856 | 846 | 727 | 809 | 879 | 876 | 953 | 967 | 890 | 851 | 928 |
| 2011 | 1,003 | 896 | 978 | 902 | 940 | 926 | 934 | 910 | 919 | 927 | 1,002 | 1,037 |
| 2012 | 989 | 931 | 924 | 904 | 898 | 935 | 972 | 946 | 955 | 980 | 976 | 987 |
| 2013 | 958 | 995 | 932 | 916 | 921 | 901 | 995 | 977 | 1,069 | 1,080 | 1,087 | 1,111 |
| 2014 | 1,058 | 1,020 | 1,030 | 959 | 973 | 987 | 1,023 | 1,126 | 1,089 | 1,056 | 1,097 | 1,074 |
| 2015 | 1,067 | 1,099 | 1,003 | 1,059 | 1,073 | 1,041 | 1,061 | 1,011 | 1,073 | 1,084 | 1,164 | 1,155 |
| 2016 | 1,113 | 1,108 | 1,180 | 1,140 | 1,130 | 1,089 | 1,170 | 1,110 | 1,053 | 1,169 | 1,158 | 1,131 |
| 2017 | 1,182 | 1,206 | 1,198 | 1,166 | 1,253 | 1,325 | 1,272 | 1,130 | 1,047 | 1,268 | 1,376 | 1,455 |
| 2018 | 1,473 | 1,324 | 1,538 | 1,505 | 1,418 | 1,468 | 1,529 | 1,537 | 1,480 | 1,434 | 1,524 | 1,508 |
| 2019 | 1,610 | 1,657 | 1,559 | 1,591 | 1,488 | 1,421 | 1,492 | 1,458 | 1,503 | 1,466 | 1,578 | 1,628 |
| 2020 | 1,711 | 1,710 | 1,707 | 1,596 | 1,682 | 1,757 | 1,864 | 1,651 | 1,488 | 1,649 | 1,909 | 1,887 |
| 2021 | 1,835 | 1,290 | 1,508 | 1,841 | 1,890 | 1,850 | 1,817 | 1,864 | 1,799 | 1,913 | 1,930 | 2,102 |
| 2022 | 2,168 | 2,053 | 2,084 | 2,065 | 1,982 | 2,118 | 2,180 | 1,849 | 1,932 | 2,016 | 1,963 | 1,826 |
| 2023 | 1,922 | 2,028 | 2,019 | 2,136 | 2,246 | 2,194 | 2,203 | 2,008 | 2,003 | 2,098 | 2,162 | 2,459 |
| 2024 | 2,118 | |||||||||||
| - = No Data Reported; -- = Not Applicable; NA = Not Available; W = Withheld to avoid disclosure of individual company data. |
| Release Date: 3/29/2024 |
| Next Release Date: 4/30/2024 |